
Homes on the Range: The Northern Tier's Missing Households
by Arthur C. Nelson, Ph.D., FAICP
Context
This is the third installment in a series of six articles for The Western Planner identifying housing demand in the West to 2030. This installment focuses on the Northern Tier states of Idaho, Montana, North and South Dakota, and Wyoming (see Figure 1).
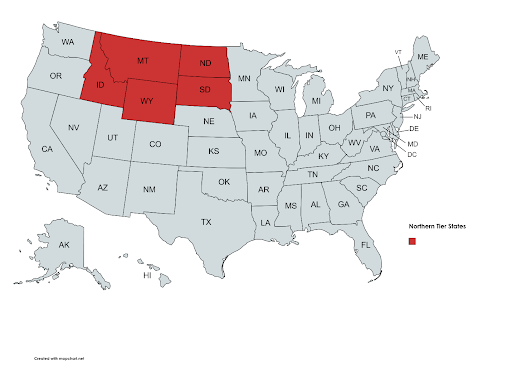
Figure 1. Northern Tier States used for the Western Planner Series, Homes on the Range
Source: Map created from https://www.mapchart.net/usa.html
As a reminder to readers of this series, I estimate households that are missing from the census tabulations. The census defines a household as everyone living in the same dwelling unit regardless of circumstances. Housing planners use these data to project future housing needs, which is flawed in my view because this assumes current living arrangements will be unchanged in the future.
For instance, according to the census, a 3-person household could be comprised of three single adults living together in the same dwelling unit. The 1990s TV program “Friends,” set in New York City, comes to mind. In effect, there are three unattached adult individuals living together even though they may prefer to live in their own dwelling units. Maybe they choose to live together, but maybe they would choose to live in their own dwelling units if there was the opportunity to do so—the 1990s TV program “Seinfeld,” also set in New York City, comes to mind in this respect.
More complex would be a household composed of a married couple with two adult children, who also have spouses and perhaps their own children, who cannot find or afford a place of their own. This household is really composed of three units of people. I call those two other sets of people “missing households” and they better reflect the nature of unmet housing needs than conventional housing statistics.
This article is about those missing households and implications for housing policy and planning.
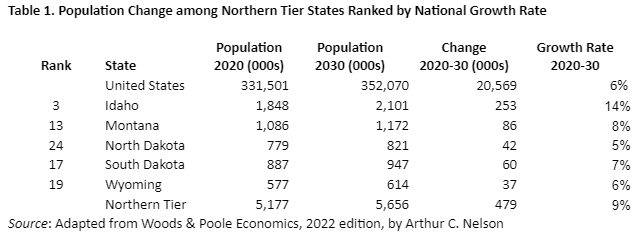
Let’s begin with some overall context. Table 1 shows that between 2020 and 2030, four of the Northern Tier states will be among the nation’s top 10 fastest growing. The Northern Tier is projected to have an overall growth rate that is twice as fast as the nation during the 2020s, 12.5% compared to 6.2%. Together, these five states are projected to add nearly one-half million residents; not a whole lot more than live in Wyoming.
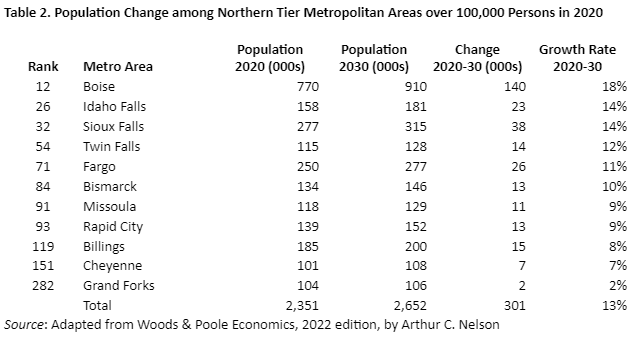
Table 2 shows the growth and growth rates of the metropolitan statistical areas (MSAs) larger than 100,000 persons in 2020. (I exclude smaller MSAs because a small metro with just a few new developments can skew its growth rate when compared to larger metros. Also, even though its central county, Gallatin, has more than 100,000 people, Bozeman is classified as a micropolitan area but will become reclassified as a metropolitan area during the 2020s.) Of the 11 metro areas, 6 rank among the top quarter of growth rates among the 355 metro areas over 100,000 persons. The Boise MSA not only ranks highest in national growth rate at 18%, but it is projected to add 140,000 people or about 30% of the entire growth of the Northern Tier states. Moreover, these 11 MSAs will account for more than 60% of the Northern Tier’s growth, 301,000 compared to 479,000.
It is from this foundation that I will assess the individual Northern Tier states and their “qualifying” core-based statistical areas (CBSAs) in terms of:
Projecting households and change to 2030, focusing on the shift in households by householder age categories to reflect Starter home demand (householders under 35 years of age), Peak housing demand (householders between 35 and 64 years of age) and Downsizing (householders 65 years of age and older);
Reporting the gap between my estimated household demand and observed households in 2021 I use a method different from that reported in the first installment for reasons I will explain later;
Projecting overall household-based housing needs for the Northern Tier western states and their qualifying CBSAs; and
Addressing the extent to which state level policies are aligned to meet the housing needs of the Northern Tier states—or not.
I say “qualifying” CBSAs because they account for more population agglomerations than metropolitan areas. A metropolitan statistical area (MSA) has a central place such as a city of 50,000 or more residents. A micropolitan statistical area (uMSA) has a central place such as a city of between 10,000 and 50,000 persons. (I use the letter “u” as a substitute for the Greek letter mu which the Census Bureau defines as “micro”). In the west, MSAs and uMSAs are comprised of one or more central counties. While MSAs and uMSAs are often merged into combined statistical areas or CSAs, my analysis is of the individual MSAs and uMSAs that are together labeled CBSAs. Finally, a “qualifying” CBSA is one that had a sufficient sample size to qualify for the American Community Survey (ACS) 1-year survey, meaning that a discrete geographic area such as an MSA or uMSA has at least 65,000 persons.
The bottom line is that I worry that the 20th century attitudes toward housing which are especially prevalent in the Northern Tier states are not sufficient to address 21st century housing needs. But there is evidence that this may be changing, in ways I will illustrate later in the article.
The following sections are patterned after the second installment which addressed missing households in the Northern Tier. Accordingly, apologies to the astute reader for repetitious language.
Post Baby-Boom Household Trends
Housing demand is driven by households. A household is either a family or non-family group living in a single housing unit, meaning that one household regardless of its size or features equals one occupied housing unit. In this section, I estimate the overall demand for occupied housing units to 2030 for Northern Tier states and qualifying CBSAs. In the next section, I estimate the number of “missing” households using the 2021 ACS 1-year sample. These are households have not formed for want of housing such as young adults returning home from college, young adults who stay home many years into adulthood, couples living as roommates, and so forth. For reasons explained in the second section, I use the 2000 Census as the benchmark year. While 2021 was the height of the COVID-19 pandemic, it was also the height of the largest housing boom since the middle 2000s, about 15 years earlier. By comparing the number of households there should be in 2021 based on the headship rates in 2000, I estimate the “missing households.” The third section calculates overall household demand in 2030 based on projections plus missing households in 2021. The final section highlights leading examples of what some communities are doing and what more can be done.
I noted in the lead article to this series that a very large share of our civic leaders seems to have the view that the future will be like their past. This is very short-sighted thinking with potentially catastrophic implications for housing. This section offers a sobering perspective for the Northern Tier states.
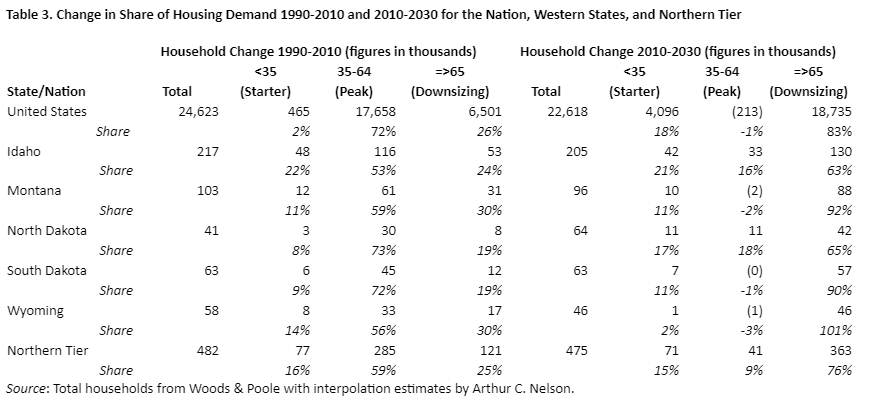
In review, I divide housing demand into three broad groups based on householder age. Those households headed by a person less than 35 years of age are typically looking for Starter homes such as apartments, condominiums, townhouses, and smaller homes on smaller lots. Those between 35 and 64 years of age are at their Peak housing demand stage of life where partners with children and pets want larger homes on larger lots. America became a suburban nation between about 1960 and 1990 as parents of baby boom children born between 1946 and 1964 wanted housing and yard space which is exactly what suburbs provided to most of them. For their part, between about 1980 and 2010, boomers sought homes to raise their families in the suburbs they knew. Beginning in 2011, however, boomers began turning 65, which is the age at which I classify householders as Downsizing as they seek smaller homes on smaller lots or attached options. By 2029, all boomers will have entered the Downsizing stage, though certainly this is an over-generalization. Table 3 shows the numerical shift in demand for housing by these three household types for the nation, each of the five Northern Tier states, and the Northern Tier as a whole. Here are the key trends as I see them:
The share of Starter home householders is projected to increase in all five Northern Tier states. However, they will grow by the largest share in Idaho at 42% followed by Montana and North Dakota at 11 and 10%, respectively. South Dakota’s started households will grow by 7% with Wyoming projected at just 1%. These rates are roughly comparable to those seen during the period 1990-2010 for both individual states and the Northern Tier as a whole.
The share of change attributable to Peak housing households will increase in only Idaho, at 16% or less than a third of the growth seen in the prior period, 1990-2010, and North Dakota at 18% which is less than a quarter of the prior period. After seeing very large gains among Peak housing households during the prior period, all the other states are projected to lose such households between 2010 and 2030. While the Northern Tier saw a 59% increase in Peak housing households in the prior period, it is projected to add only 9% to 2030.
Among Downsizing households, the Northern Tier is projected to grow by about 76% compared to 83% for the nation. Indeed, Downsizing households will account for the largest increases among all age groups in each of the five states headed by Wyoming at 101% followed by Montana at 92% , South Dakota at 90% , North Dakota at 65% and Idaho at 63%.
I do not know many elected officials who understand the implications of America’s aging households on housing markets generally or on their own communities. (One is Elaine Clegg, a former member of the Boise city council, who contributes insights about Boise’s housing policies below.) This series of articles in The Western Planner may give local planners and other professionals what they need to inform elected officials of the monumental change to come. This will be aided by tables 4 through 8 which report estimates of household change by householder age for each of the Northern Tier states and their qualifying CBSAs. I invite readers to study these data more carefully for trends applicable to CBSAs of interest to them. Here are the topline results for qualifying CBSAs in each state:
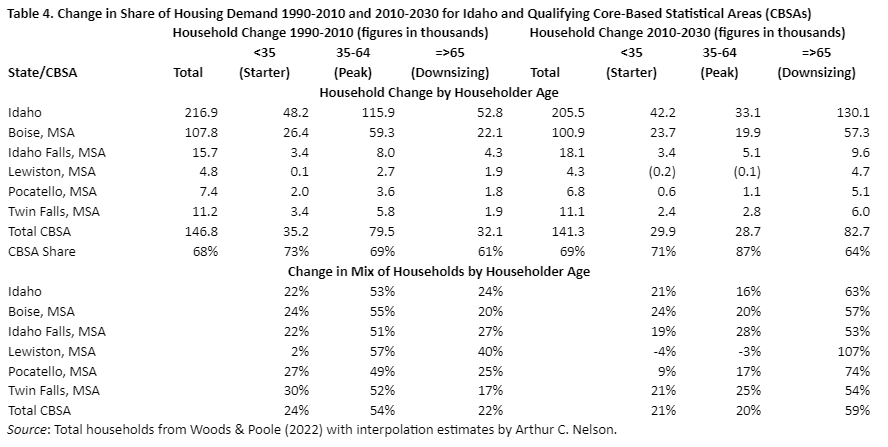
In Idaho (Table 4), Lewiston will lose Peak housing demand households between 2010 and 2030 with much of this occurring in the present decade. In all the other CBSAs, however, Peak housing demand will account for only 17% to 28% of the change in households by householder age. This is in stark contrast to the period 1990 to 2010 where those households accounted for about half or more of the change. In Lewiston, all or more than all (as in more than 100%) of the change in housing demand will be among Downsizing households. In all qualifying CBSAs, Downsizing households will account for the largest share of change in demand, especially during the 2020s. While Peak housing demand households are in decline and Downsizing households are in ascendancy, Starter home households may be squeezed as Downsizing households may not sell their homes for lack of demand and suitable alternatives.
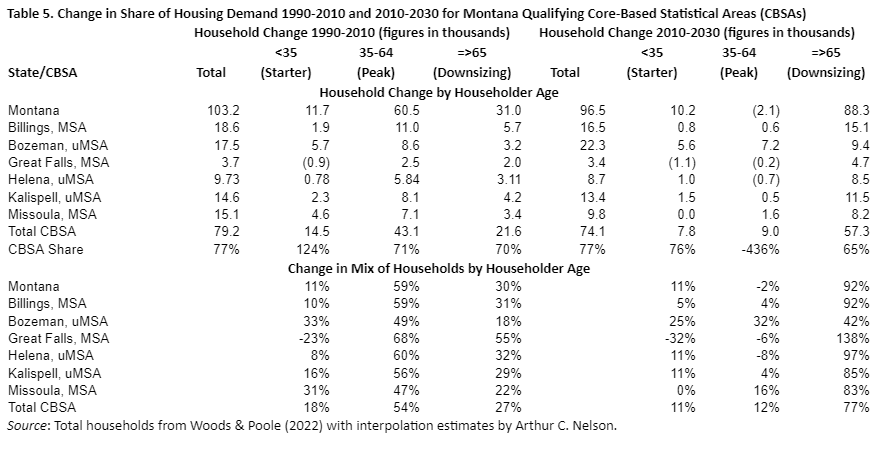
Table 5 shows projections for Montana that are quite different. Except for Bozeman, all qualifying CBSAs will see the equivalent of all or near all the change in households occuring among those householders aged 65 and more. Except for Bozeman and Missoula, all qualifying CBSAs will see very small increases, and some will see decreases, in Peak housing demand households. For Great Falls, the situation is even more dire as projections show a loss of one third of its Starter home households with Missoula showing no increase while the others range from small increases to Bozeman with an increase of about a quarter.
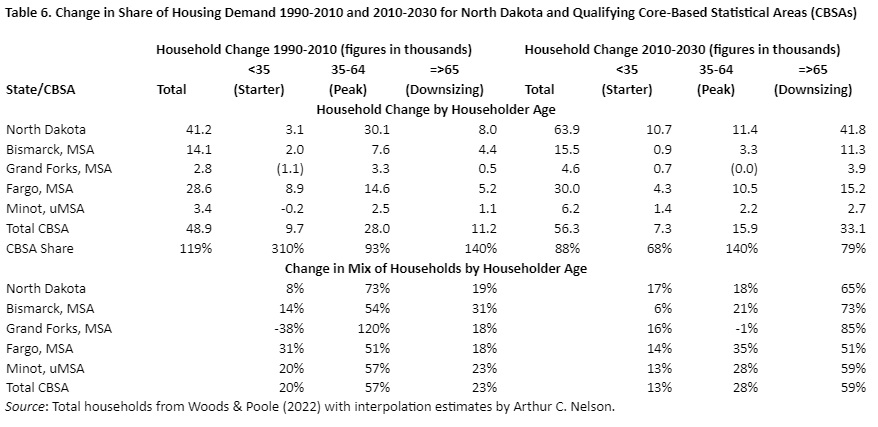
North Dakota’s projected growth trends are quite different between two sets of CBSAs (see Table 6). Fargo and Minot would see healthy growth in Starter (respectively 14% and 13%) and Peak households (respectively 35% and 21%, the latter being well above the national average). In contrast, its Downsizing household growth at 59% and 51%, respectively, are well below the state and national trends. On the other hand, Bismarck is projected to see the lowest change among Starter households at 6% and second highest change in Downsizing households at 73%, although growth in Peak housing demand households would be modest at 21%. Grand Forks, however, would see the largest increase in Downsizing households at 85% and a loss of Peak housing households. Although, at 16%, Starter households would increase close to the state and national averages.
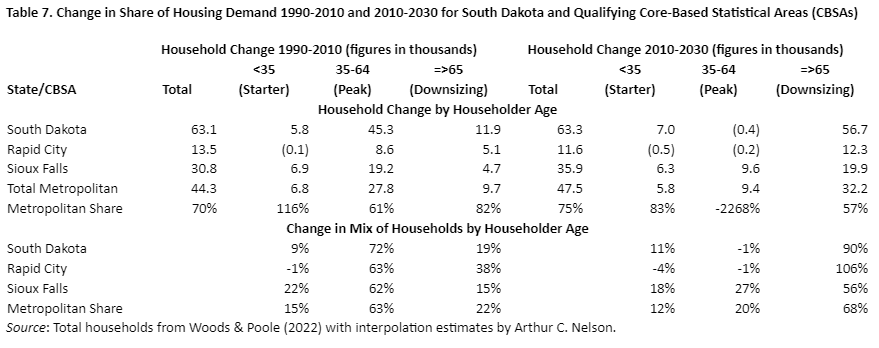
Trends in South Dakota (reported in Table 7) show considerable stress in Rapid City. Analysis shows that whereas Downsizing households would increase by 106% over the 2010-2030 period, both Starter and Peak housing households would decline. In contrast, Sioux Falls is projected to see trends very similar to Fargo and Minot with less growth among Downsizing households compared to the state and the nation, and growth among Starter and Peak housing households being higher than the state and nation.
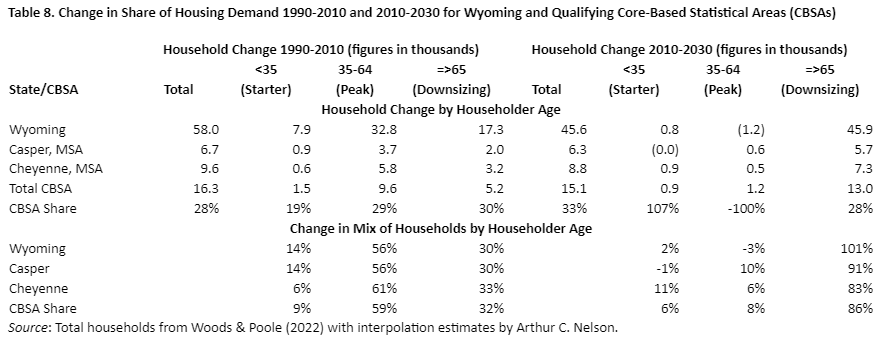
Wyoming is a true outlier as seen in Table 8. Both qualifying CBSAs, Casper and Cheyenne, are projected to be stressed with Downsizing households growing by more than three quarters (91% and 83% respectively). Casper’s Starter households are projected to fall compared to 1990-2010 although its 10% growth in Peak housing demand households is the one bright trend compared to the state which is projected to fall. At 11% growth, Cheyenne’s Starter households would outpace the state. Its growth among Peak housing households at 6% will be a bright trend for the state but lag the nation.
Tables 4 through 8 provide planners and policymakers in each of the Northern Tier states and their qualifying CBSAs with guidance on the nature of change in housing demand between 2010 and 2030. Indeed, that change has been accelerating since 2010 and will not plateau until boomers begin passing away in large numbers starting in the 2030s. For the rest of this decade and well into the next, Downsizing households will dominate nearly all the markets and, in some cases, will be the only source of the change in housing demand.
In several metropolitan areas in the Northern Tier, Downsizing households will constitute all the change in households by householder age. That is, the entire change in households with householders 65 years of age of older between 2010 and 2030 will be due to those households either moving into these metros or aging out of the Peak housing group into the Downsizing group. Accordingly, these are the highest risk metropolitan areas for housing stress which is often also associated with economic and social service stress. As a benchmark, any qualifying CBSA where Downsizing households are projected to account for at least three quarters (rounded) of the net change in households is considered at risk for not being able to meet emerging housing needs. I suspect this is a conservative figure; growth of half or more might be more realistic. Those qualifying CBSAs where the equivalent of more than three quarters of the net change in households will be 65 years of age or older are listed below in alphabetical order:
Idaho
Lewiston, MSA
Pocatello, MSA
Montana
Billings, MSA
Great Falls, MSA
Helena, uMSA
Kalispell, uMSA
Missoula, MSA
North Dakota
Bismarck, MSA
Grand Forks, MSA
South Dakota
Rapid City
Wyoming
Casper, MSA
Cheyenne, MSA
I will next present estimates of the household gap in 2021 for the Northern Tier states and their qualifying CBSAs.
Missing Households in the Northern Tier, 2021
In the opening article of this series, I noted that the nation arguably produced more housing than needed to meet market demand during the 2000s, which led in part to the Great Recession (GR) of 2007-09. Since then, production faltered from the period 2012, after the GR, to 2019, before the COVID-19 pandemic. The first article used Up for Growth’s Housing Underproduction data to estimate housing units missing from the inventory of homes in 2019 (see https://upforgrowth.org/apply-the-vision/housing-underproduction/). Using 2021 ACS data and revisiting the methodology used by Up for Growth, I calculate simply “missing” households and do not adjust for vacant or uninhabitable units. Also, unlike Up for Growth which bases its analysis on PUMAs (public use micro-sample areas) for units of 100,000 persons to achieve full geographic coverage of the nation while sacrificing geographic fidelity with CBSAs, I sacrifice full geographic coverage for calculating the household gap for qualifying CBSAs. I also changed the terminology from the “household gap” to “missing households” but the method does not change.
The calculation for Missing Households is as follows:
Missing Households =
Headship rates between 15 to 34, 35 to 44, 45 to 54, 55 to 64, and 65 years of age or older from the 2000 Census, where headship rate is calculated as the number of householders within each age cohort divided by the number of persons also within each age cohort, times the number of persons within each age cohort from the 2021 ACS. The technique is more detailed that used in the Up for Growth Housing Underproduction study.
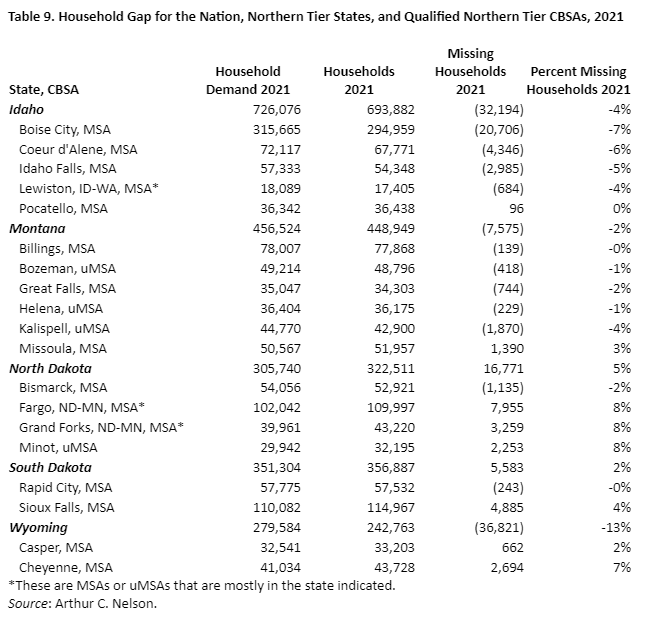
This calculation is done for each county within each CBSA based on the Census 2021 CBSA geographies, and then summed to each CBSA. It is also done for each state. Table 9 reports results for the Northern Tier states and their qualifying CBSAs.
The method assumes that the year 2000 reflected “normal” household formations in the absence of economic, social, or other turmoil. It also assumes constant headship rates by householder age with respect to race, ethnicity, and income over time, among other factors. While obviously not strictly true, the Census for 2000 was indeed a year at the end of a decade mostly devoid of economic, social, and other turmoil. Moreover, household incomes by race, ethnicity, and age have not changed much (unfortunately) between 2000 and 2021. Nonetheless, future work will focus on making more refined headship estimates that will be applied to more refined cohort data accounting especially for race and ethnicity. While readers can study these data for their own particular purposes, my focus here is on the larger picture.
Idaho
Idaho was “missing” about 32,000 households in 2021, meaning that those households were not formed because they were doubling up with others in the same housing unit. About two-thirds of those missing households are from the Boise City MSA, being about 20,000. Only Pocatello had a balance between households existing in 2021 and those projected.
Montana
Montana would seem to have about 7,500 missing households with Kalispell leading the CBSAs at about 1,900 missing households. Missoula, however, appears to have about 1,400 more households than the projected need. It is also home to a major Montana university which may help explain the phenomenon.
North Dakota
North Dakota, as well as the Fargo, Grand Forks, and Minot CBSAs appear to have more households than projected based on 2000 headship rates, being about 17,000, 8,000, 3,000 and 2,000 respectively. In recent years, many parts of North Dakota have seen an influx of fossil-fuel-industry-related employment with substantial localized increases in housing supply which may help account for its growth in households relative to projections.
South Dakota
Similar to its neighbor to the north, South Dakota has more households than projected as does its largest metropolitan area, Sioux Falls, at about 5,600 and 4,900 respectively.
Wyoming
Wyoming is a true outlier among all the Northern Tier states in having such a large mismatch between projected and existing households, falling nearly 37,000, or 13%, short. Yet its two qualifying CBSAs have more households than projected. Some parts of Wyoming are stressed with the influx of tourist and second home demand that absorb large shares of new housing that leave residents scrambling to meet their housing needs. One approach to addressing this concern is reviewed below.
I will use these figures to estimate households that will need to be housed in 2030.
New Homes Needed on the Range in the Northern Tier between 2021 and 2030
Planning is all about anticipating needs and choreographing the resources to meet them, consistent with the smart planning goals I outlined in the first article of this series. In this section, I project total new households for the Northern Tier and its qualified CBSAs. These include missing households. In effect, this is akin to estimating the need for occupied housing units since one household equals one occupied dwelling unit.
Table 10 reports the total households projected for 2030 by Woods & Poole Economics, the number of households existing in 2021 from the ACS, the number of new occupied housing units needed between 2021 and 2030, and the percent of those new units relative to households existing in 2021. These figures do not include the need for vacant units, seasonal homes, units not available for occupancy, or other types of units that are not occupied. In resort areas, further adjustments are needed to address seasonal housing for both seasonal residents and the seasonal labor force. This figure does not include housing units that are lost over the decade because of disasters (such as floods and fires) or demolition to make way for redevelopment. I am engaged in research that will try to estimate this in future publications. As a rule of thumb, four tenths of one percent of the housing stock older than 10 years of age is lost, so over the period 2021 to 2030 the equivalent of about 4.0% of the stock existing in 2020 would need to be added to the new dwelling unit demand. For now, I will be conservative because we are unlikely to meet the figures reported in Table 10 anyway.
While I will leave it to readers to assess the implications of Table 10 on their areas of interest, key overall findings are:
Between 2021 and 2030, nearly a quarter million new households should be expected in the Northern Tier states who would occupy dwelling units if given a chance. This is roughly 11% more households than existed in 2021. The need is about 26,000 new dwelling units each year. It includes missing households.
Idaho will account for about 40% of the total need. Montana will account for about another quarter of the need followed by South Dakota and Wyoming at about 13% and then North Dakota for about 10% of the need.
By itself, the Boise CBSA will account for about 10% of the new household demand. Indeed, the next two CBSAs with the largest shares of demand are also in Idaho, being Coeur d'Alene and Lewiston, comprising about 5% of the Northern Tier’s new household demand each. In order, the Bozeman, Idaho Falls, Bismarck, Kalispel, Billings, Fargo, and Rapid City CBSAs round out the top ten largest shares of projected new households.
Although the need for about a quarter of a million new households to occupy homes between 2021 and 2030 may seem like a significant challenge, it is manageable. For instance, if something on the order of one quarter of all homes larger than 2,000 square feet added an accessory dwelling unit (ADU) during this period, I estimate that we could meet household demand for all new dwelling needed to meet the needs of new households by 2030. After all, given the demographic trends presented in the first section, there will be a decline in Peak housing households with the largest share of change among Downsizing households and a smaller share among Starter home households. Figure 2 illustrates the nature of the housing needs of households to 2030 and beyond.
Considering the nature of change in housing demand based on demographic shifts, the market might deliver these and related kinds of units ADUs if regulatory and financial institutions can be made more accommodating. That is the topic of the last section.
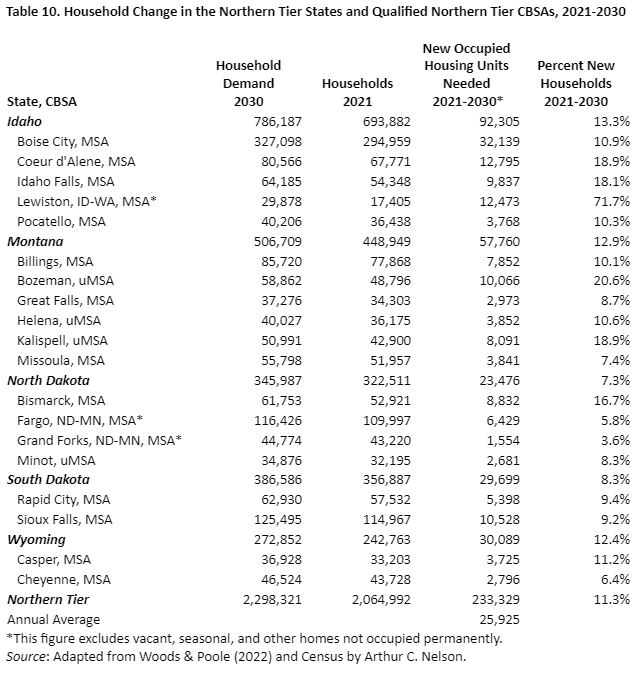
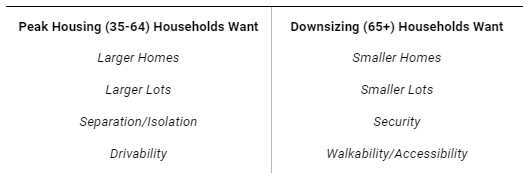
Figure 2. What Peak and Downsizing households want for their homes and communities
Note: 65+ means householders who are 65 years of age or older.
Widely Varying Approaches to Meeting Housing Needs in the Northern Tier
With few exceptions, Northern Tier states do not face the kind of development pressures seen in much of the Southern Tier, the Northwest, or especially California. Part of this is geography with vast supplies of land available in most metropolitan areas. Combined with slow to moderate growth rates, adequate public facilities, and moderately lower housing construction costs compared to other regions, the Northern Tier is able to meet its housing needs substantially. Two examples of this are highlighted below: Fargo and Sioux Falls. In contrast, rapid growth in the Boise metropolitan area stresses its ability to meet housing needs. Efforts by Boise city to expand housing supply and choices are reviewed in the third focus below. A truly remarkable exception to Northern Tier housing markets is Jackson/Teton County where high-end development and affluent households are squeezing the local market’s ability to provide workforce and affordable housing. Its unique housing impact mitigation program is the fourth focus that is reviewed. I offer a special focus on Montana at the end. By the time this article is published, Montana may have become the first Northern Tier state to use legislation to expand housing options significantly statewide as well as mandate that local governments meet housing needs.
Focus on Fargo
In her correspondence with me, Nicole B. Crutchfield, the city planning director, notes that Fargo MSA is a moderately growing region where about 58% of the households are renters. Based on her experience elsewhere, local land use regulations allow more "by-right" development flexibility than other areas. Combined with few constraints on land supply and that much of the demand for new homes including those on smaller lots and attached homes is met through greenfield development away from established neighborhoods, NIMBY (not-in-my-backyard) pressures are subdued. Another factor is the strong presence of local developers in local housing production, unlike larger and faster growing metropolitan areas where national high-production home builders often dominate. This combination of factors allows the city and the metropolitan area to meet market needs for a wide range of housing products without much policy intervention. At the local area, they do see not enough supply for cost-burdened households, with 41% of all renters are cost-burdened. Homeownership is out of reach for those with incomes under $75,000.
Focus on Sioux Falls
In reaching out to Sioux Falls about their experience, Kevin Smith, Assistant Director Planning & Development Services, offered several insights. Although Sioux Falls has its NIMBY concerns, like other Northern Tier communities, local attitudes have been traditionally supportive of development and planning. For instance, the Shape Sioux Falls Planand supporting Shape Places Zoning Ordinance allows for a large variety of housing types and densities. There are also strong relationships between planning and the local development community. Importantly, a large number of developers are successful in filling specific niches of housing types, styles, and price ranges. The result is a community-wide commitment to meet the need for many housing types and densities.
But the ability of Sioux Falls to meet housing needs goes beyond this. With Casey Dawkins back in 2004, I highlighted Sioux Falls' novel and effective growth tier planning scheme. This was through an American Planning Association Planning Advisory (PAS) Report called Urban Containment in the United States: Regional and Metropolitan Growth Management. Based substantially on Smith's observations, the city uses planning to meet the demands of new growth through "Growth Tier Maps." Those maps are updated each year to show both the current and future areas that will be available for the provision of urban services. In effect, infrastructure commitments are made in advance of where new development is needed. These investments are based on the city’s financial capabilities to provide the necessary infrastructure to support growth. Based on historic and projected trends, the city thus aims to make sufficient land available concurrent with meeting growth needs. The result is that the city annexes approximately 700 acres per year to support both public and private development needs.
Focus on Boise
The Boise metropolitan area is one of the nation’s fastest growing and is stressed in meeting demand. My calculations show it also leads the Northern Tier in missing households. Boise, the largest city in population and land area, is repositioning its planning and regulatory framework to expand housing supply. Elaine Clegg, a member of the Boise city council until 2023 and now executive director of Valley Regional Transit, noted that this process is informed through a study showing, among other things, that in 2020, 77% of the projected demand of nearly 28,000 new homes over the next 10 years will be for those earning 80% or less of the area median income (AMI). Unfortunately, the city has already fallen more than 4,000 units short of this target. The study found that land constraints are substantial and that to meet demand, neighborhoods will need to increase housing density by 26% to meet housing needs. This has led to several initiatives such as:
Rewriting the zoning code. Among other things, it now allows up to four units on every single-family lot (subject to affordability and sustainability criteria) as well as significantly increasing densities and mix of uses on all transit accessible corridors.
Using City’s Housing Land Trust to leverage city-owned property to provide mixed income housing on those sites, ensuring their availability to lower and moderate incomes through deed restrictions.
Facilitating use of the City’s accessory dwelling units (ADUs) through a demonstration project that helps homeowners through the financing and regulatory maze with either a tiny home ADU or a stick-built ADU of a pre-approved design.
Providing leadership in expanding facilities especially for the homeless as well as creating permanent supportive housing options.
Focus on Jackson/Teton County
In certain markets, external demand for housing stresses the local supply of workforce and affordable housing. Such is the case in Jackson/Teton County. That market has become a mecca for affluent second home, retirement, and permanent residents, as well as high-end tourist-related ventures. Yet its limited supply of land, expensive facilities, and high housing construction costs squeezes housing availability for the very households who make Jackson/Teton County function as a community. To help expand the supply of workforce and affordable housing, Jackson/Teton County has created an innovative housing impact mitigation program. In effect, certain new high-end housing and commercial development must mitigate its impact on workforce and affordable housing by building a share of those units or pay a fee in-lieu. Housing impact mitigation funds are used by local agencies to add new affordable and workforce housing, often leveraging other resources to expand the supply even more.
Special Focus on Montana
Responding to rising housing prices and lagging housing production, the Republican-dominated 2023 Montana legislative assembly was active in advancing several initiatives. The overarching concerns among Republican legislators was the need for more starter homes and “missing middle” homes such as accessory dwelling units, plexes (2-, 3- and 4-plex structures), townhouses, and low-rise apartments, as well as efforts to expand workforce housing. Three bills are especially relevant to this article, and some if not all may have been adopted by the time this article is published.
Senate Bill 382 would create the Montana Land Use Planning Act. It would reduce the time to review development proposals, require that local governments establish planning commissions, enhance public participation, and adopt land use plans and land use maps. The bill would also require local governments to evaluate population trends and act to meet current and future housing needs, as well as address environmental hazards. Perhaps this article can help with the housing analysis.
Senate Bill 323 would allow for duplex housing by-right in existing city zoning regulations in incorporated places of at least 5,000 persons.
Senate Bill 245 would reform local zoning in incorporated places of more than 7,000 persons by allowing multifamily housing and mixed-use in development in all commercially zoned land where water and sewer service is available. (My own research suggests that many cities over-zone the supply of commercial land with the perverse effect of reducing its property value.) The bill would limit local government power over parking requirements, height restrictions, and setbacks among others to make it easier procedurally and more affordable economically to build housing in these areas.
Perspectives About the Northern Tier Going Forward
The Northern Tier states are dominated by conservative politics with a mostly laissez-faire attitude leading to nominal state and local policy interventions in housing markets. For the most part, the combination of slow to moderate growth, sufficient land supply, adequate public facilities, and relatively benign NIMBY intervention appears to allow most markets to generate housing that is substantially sufficient to meet demand. And yet, with the exception of the Dakotas, the Northern Tier is not providing sufficient housing supply and choices to tens of thousands of missing households. Excluding the Dakotas, I estimate that there would be about 80,000 more households in the Northern Tier states of Idaho, Montana and Wyoming but for housing constraints. However, Montana is upping its game by requiring local governments to expand housing supply and choices. The challenge to meet the housing needs of vastly more missing households in the Northwest, particularly Oregon and Washington states, will be addressed in the next installment.
About the Series Author
Arthur C. Nelson, Ph.D., FAICP, is Professor Emeritus of Urban Planning and Real Estate Development at the University of Arizona where he designed an online Master of Real Estate Development program that has become the nation’s top-rated and most diverse graduate real estate degree opportunity. He is also Presidential Professor Emeritus of City & Metropolitan Planning at the University of Utah where he was founding director of the Metropolitan Research Center and the Master of Real Estate Development Program. Nelson is from Oregon and has engaged in professional practice and/or research in all the conterminous western states. He is the author of more than 20 books, more than 400 other publications, and has been a principal investigator or Co-PI of more than $50 million in grants and contracts.
©2023 by Arthur C. Nelson. All rights reserved.