
Homes on the Range: The Northwest’s Missing Households
by Arthur C. Nelson, Ph.D., FAICP
Overview
This is the fourth installment of a series comprised of six articles for The Western Planner calculating housing demand in the West to 2030. This installment focuses on the Northwest states of Alaska, Oregon, and Washington (see Figure 1).
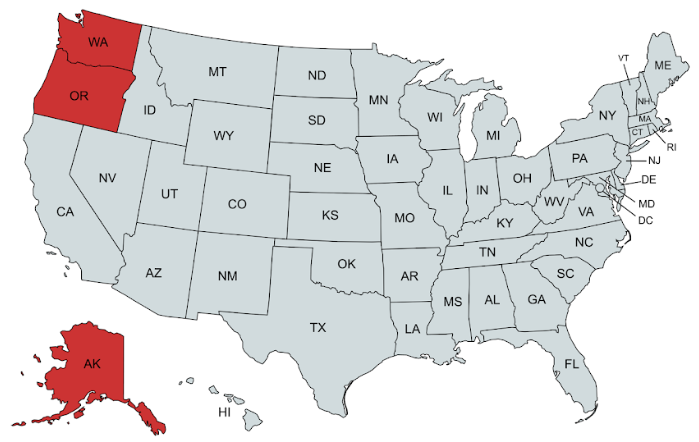
Figure 1. Northwest States used for the Western Planner Series, Homes on the Range
Source: Map created from https://www.mapchart.net/uSA.html
As in earlier installments, I estimate households that are missing from the census tabulations. The census defines a household as everyone living in the same dwelling unit regardless of circumstances. Housing planners use those data to project future housing needs, which is flawed in my view because this assumes current living arrangements will not change in the future.
For instance, according to the census, a three-person household could be comprised of three single adults living together in the same dwelling unit. The 1990s TV program “Friends,” set in New York City, comes to mind. In effect, there are three unattached adult individuals living together even though they may prefer to live in their own dwelling units. Maybe they choose to live together, but maybe they would choose to live in their own dwelling units if there was the opportunity to do so—the 1990s TV program “Seinfeld,” also set in New York City, comes to mind in this respect.
More complex would be a household composed of a married couple with two adult children, who also have spouses and perhaps their own children, who cannot find or afford a place of their own. This household is really composed of three units of people. I call those two other sets of people “missing households” and they better reflect the nature of unmet housing needs than conventional housing statistics.
This article is about those missing households and implications for housing policy and planning.
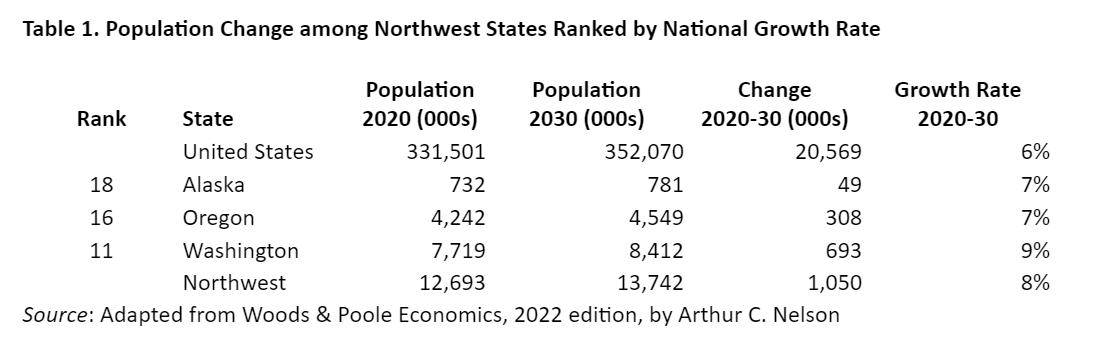
For context, Table 1 shows that between 2020 and 2030, four of the Northwest states will be among the nation’s top 20 fastest growing. The Northwest is projected to have an overall growth rate that is about a third higher than the nation during the 2020s, 8% compared to 6%. Together, these three states are projected to add more than one million residents.
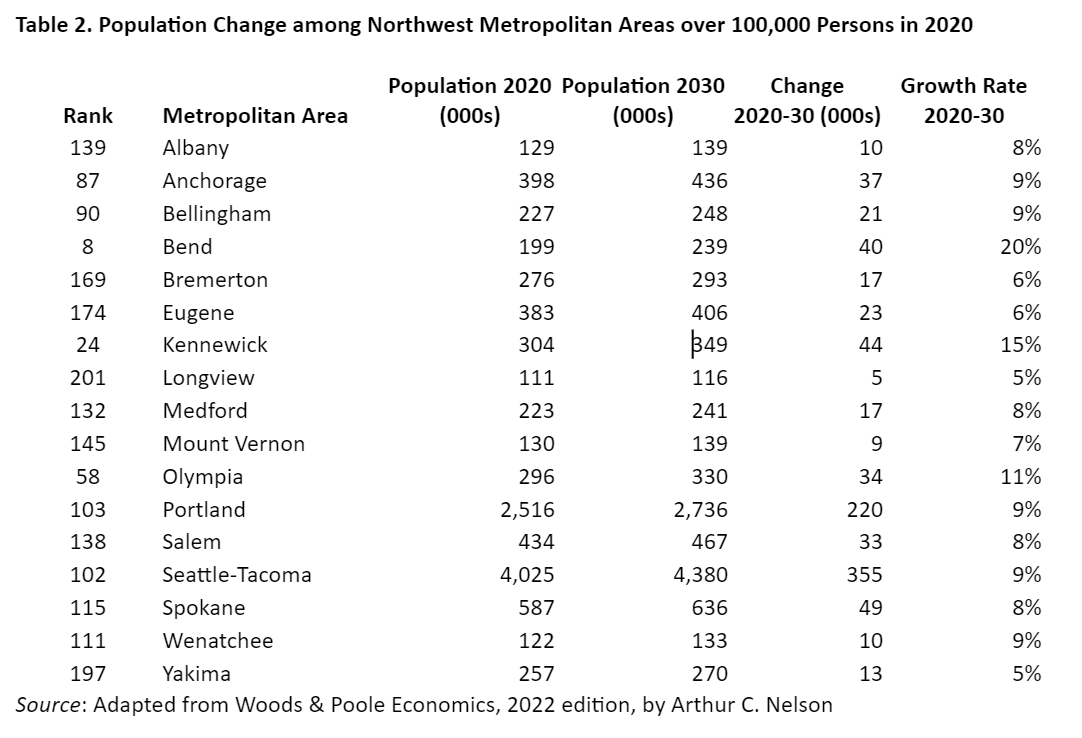
Table 2 shows the growth and growth rates of the metropolitan statistical areas (MSAs) larger than 100,000 persons in 2020. (I exclude smaller MSAs because a small metro with just a few new developments can skew its growth rate when compared to larger metros. Of the 17 metro areas, 5 rank among the top quarter of growth rates among the 355 metro areas over 100,000 persons. Moreover, these 17 MSAs will account for nearly 90% of the Northwest’s growth, 938,000 compared to 1,050,000.
It is from this foundation that I will assess the individual Northwest states and their “qualifying” core-based statistical areas (CBSAs) in terms of:
Projecting households and change to 2030, focusing on the shift in households by householder age categories to reflect Starter home demand (householders under 35 years of age), Peak housing demand (householders between 35 and 64 years of age) and Downsizing (householders 65 years of age and older);
Reporting the gap between my estimated household demand and observed households in 2021 I use a method different from that reported in the first installment for reasons I will explain later;
Projecting overall household-based housing needs for the Northwest western states and their qualifying CBSAs; and
Addressing the extent to which state level policies are aligned to meet the housing needs of the Northwest states—or not.
I say “qualifying” CBSAs because they account for more population agglomerations than metropolitan areas. A metropolitan statistical area (MSA) has a central place such as a city of 50,000 or more residents. A micropolitan statistical area (uSA) has a central place such as a city of between 10,000 and 50,000 persons. (I use the letter “u” as a substitute for the Greek letter mu which the Census Bureau defines as “micro”). In the west, MSAs and uSAs are comprised of one or more central counties. While MSAs and uSAs are often merged into combined statistical areas or CSAs, my analysis is of the individual MSAs and uSAs that are together labeled CBSAs. Finally, a “qualifying” CBSA is one that had a sufficient sample size to qualify for the American Community Survey (ACS) 1-year survey, meaning that a discrete geographic area such as an MSA or uSA has at least 65,000 persons.
The bottom line is that I worry that the 20th century attitudes toward housing provision which are especially prevalent in the Northwest states are not sufficient to address 21st century housing needs. But there is evidence that this may be changing, in ways I will illustrate later in the article.
The following sections are patterned after the second installment which addressed missing households in the Northwest. Accordingly, apologies to the astute reader for repetitious language between articles in this series.
Post Baby-Boom Household Trends
Housing demand is driven by households and their formation. A household is either a family or non-family group living in a single housing unit, meaning that one household regardless of its size or features equals one occupied housing unit. In this section, I estimate the overall demand for occupied housing units to 2030 for Northwest states and qualifying CBSAs. In the next section, I estimate the number of “missing” households using the 2021 ACS 1-year sample. These are households that have not formed for want of housing such as young adults returning home from college, young adults who stay home many years into adulthood, couples living as roommates, and so forth. For reasons explained in the second section, I use the 2000 Census as the benchmark year for calculating the “headship” rates that are applied to the 2021 ACS. While 2021 was the height of the COVID-19 pandemic, it was also the height of the largest housing boom since the middle 2000s, about 15 years earlier. By comparing the number of households there should be in 2021 based on the headship rates in 2000, I estimate the “missing households.” The third section calculates overall household demand in 2030 based on projections plus missing households in 2021. The final section highlights leading examples of what some communities are doing and what more can be done.
I noted in the lead article of this series that a significant share of our civic leaders seem to have the view that the future will resemble their past. This is very short-sighted thinking with potentially catastrophic implications for housing. This section offers a sobering perspective for the Northwest states.
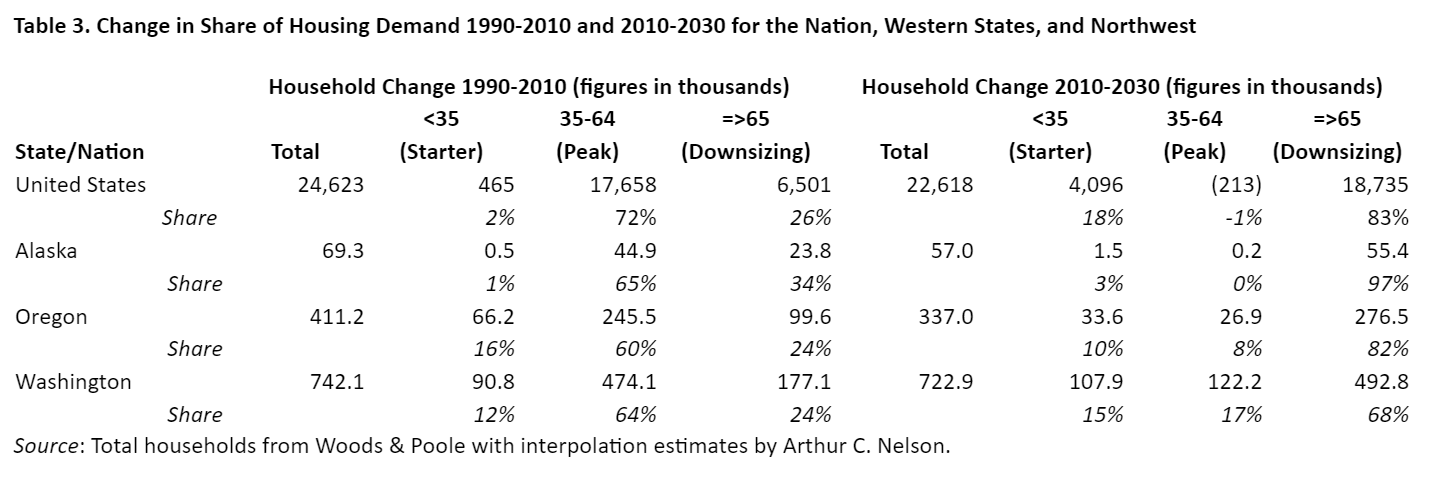
I divide housing demand into three broad groups based on householder age. The reason I do so follows. Those households headed by a person younger than 35 years of age are typically looking for Starter homes such as apartments, condominiums, townhouses, and smaller homes on smaller lots. Those between 35 and 64 years of age are at their Peak housing demand stage of life where partners with children and pets want larger homes on larger lots. America became a suburban nation between approximately 1960 and 1990 as parents of baby boom children, born between 1946 and 1964, desired housing and yard space which is exactly what suburbs provided to most of them. For their part, between approximately 1980 and 2010, boomers sought homes in the suburbs where they grew up to raise their families. Beginning in 2011, however, boomers began turning 65, which is the age at which I classify householders as Downsizing as they seek smaller homes on smaller lots or attached options. By 2029, all boomers will have entered the Downsizing stage, although this is certainly an overgeneralization. Table 3 shows the numerical shift in demand for housing by these three household types for the nation, each of the three Northwest states, and the Northwest as a whole. Here are the key trends as I see them:
During the period 1990-2010, Oregon added households with children at the fastest rate, 16%, followed by Washington at 12%, and Alaska at 1%. For comparison, the figure for the nation was 2%. Over the next period, 2010-2030, the share of Starter home householders is projected to continue to increase in all three Northwest states but at a slower pace than the 18% growth projected for the nation. Washington’s share of Starter households is projected at 15% followed by Oregon at 10%. Alaska’s share of starter households will grow by just 3%, however.
A key story revealed in Table 3 is that between 1990 and 2010, Peak housing households accounted for the largest share of household change for the nation (72%) as well as about two-thirds in all three Northwest states (Alaska at 65%, Oregon at 60%, and Washington at 64%. However, over the period 2010-2030 and consistent with national trends, the share of change attributable to Peak housing households will plummet into negative territory for the nation (-1%) the share of change attributable to Peak housing households will increase in all states, compared to falling by 1% for the nation followed by effectively 0% in Alaska, 8% in Oregon and 17% in Washington.
This is an important trend to understand. Whereas during the 20 years between 1990 and 2010, the nation and the Northwest states needed to meet the demand for households at their peak housing demand stage of life—meaning larger detached homes on larger lots, that trend is expected to reverse for the nation and Alaska, while plummeting in Oregon and Washington. The days of substantial demand for large homes on large lots is mostly over from an aggregate market perspective.
The other key trend that is emerging is how Downsizing households will dominate the market until 2030 and likely into mid-century. More than 80% of the share of change in the number of households nationally during this period will be attributable to Downsizing households (at 83%), or about three times the share during the period 1990-2010 (26%). For Alaska, the projected trend going forward to 2030 will be 97% (essentially all new housing demand) compared to 34% during the prior period. The figure toward 2030 for Oregon is 82% compared to 24% in the prior period while for Washington the figured are 68% and 24%, respectively.
In essence, housing demand toward 2030 and likely toward 2050 will be a 180-degree shift from the period 1990-2010. Whereas Peak housing households dominated the prior period, Downsizing households will dominate the market going forward. I will hazard to guess that most public officials and zoning codes are not prepared for this new reality.
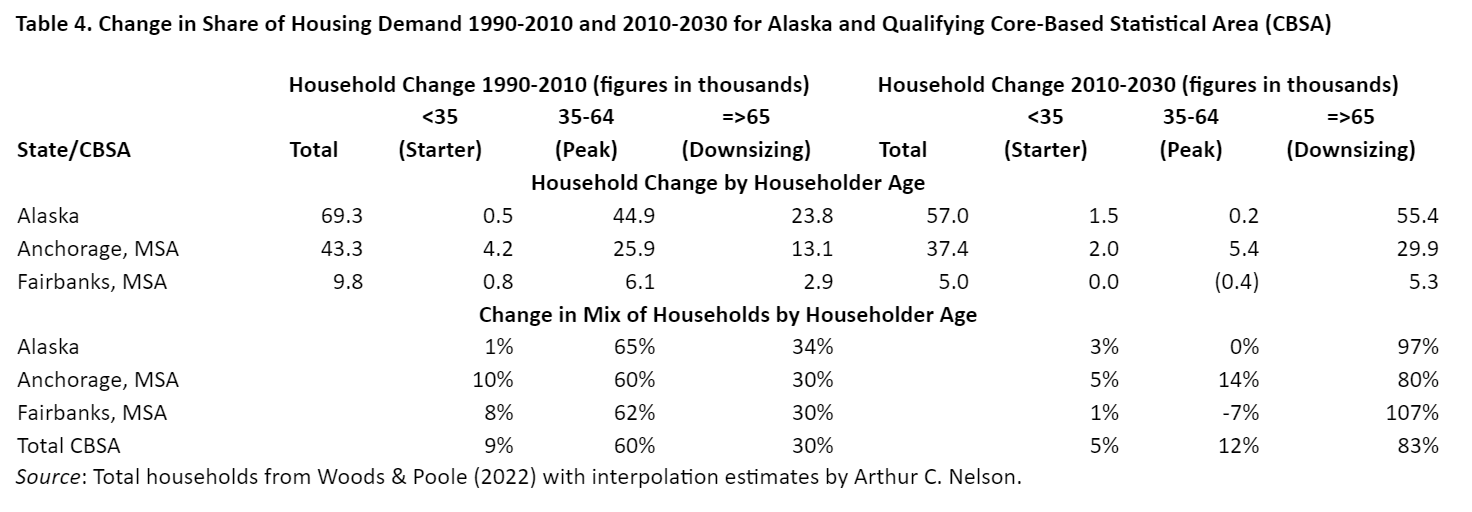
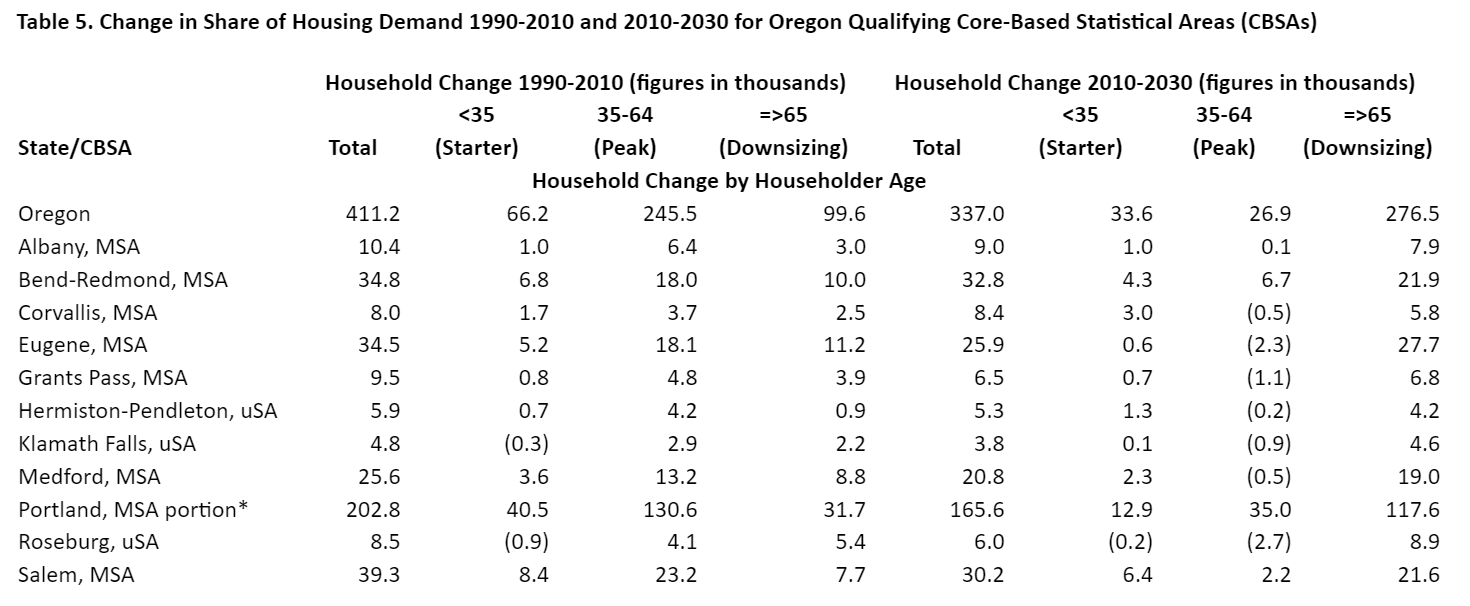
I do not know many elected officials who understand the implications of America’s aging households on housing markets in general or on their own communities. This series of articles in The Western Planner may give local planners and other professionals what they need to inform elected officials of the monumental change to come. Tables 4 through 6 provide planners and policymakers in each of the Northwest states and their qualifying CBSAs with guidance on the nature of change in housing demand between 2010 and 2030. (A qualifying CBSA is where the 1-year ACS data are reported.)
Indeed, the change in Downsizing households has been accelerating since 2010 and will not plateau until boomers begin passing away in large numbers starting in the 2030s. For the rest of this decade and well into the next, Downsizing households will dominate nearly all the markets and, in some cases, will be the only source of the change in housing demand. In several Northwest CBSAs, Downsizing households will constitute all the change in households by householder age. That is, the entire change in households with householders 65 years of age of older between 2010 and 2030 will be due to those households either moving into these metros or aging out of the Peak housing group into the Downsizing group. Accordingly, these are the highest risk metropolitan areas for housing stress which is often also associated with economic and social service stress.
I invite readers to study these data more carefully for trends applicable to CBSAs of interest to them. Here are the topline results for qualifying CBSAs in each state:
In Alaska (Table 4), about 80% of the share of change in households will be among Downsizing households in Anchorage and all the change in Fairbanks. Indeed, projections show that Fairbanks would see a decline in Peak housing households to 2030.
Table 5 shows projections for Oregon. Across all CBSAs reported, Downsizing households dominate change. Indeed, Corvallis, Eugene, Grants Pass, Hermiston-Pendleton, Klamath Falls, Medford, and Roseburg are all projected to see the number of Peak housing demand households fall toward 2030. However, most CBSAs are projected to see growth among Starter home households often at about the same rate as the prior period of 1990-2020. Nonetheless, three CBSAs stand out for having substantial growth among all three householder age groups: Bend, Portland, and Salem.
Washington’s projected growth trends are similar. Among those CBSAs projected to be dominated by Downsizing households are Aberdeen, Bremerton, Centralia, Longview, Mount Vernon-Anacortes, Oak Harbor, Port Angeles, Shelton, Spokane, Walla Walla, and Wenatchee. On the other hand, CBSAs show robust growth in Start and Peak Housing households are Kennewick-Richland, Olympia-Tumwater, Seattle-Tacoma-Bellevue, and the Washington side of the Portland MSA.
I will next present estimates of “missing households” in 2021 for the Northwest states and their qualifying CBSAs.


Missing Households in the Northwest, 2021
In the opening article of this series, I noted that the nation arguably produced more housing than needed to meet market demand during the 2000s, which led in part to the Great Recession (GR) of 2007-09. Since then, production faltered from the period 2012, after the GR, to 2019, before the COVID-19 pandemic. The first article used Up for Growth’s Housing Underproduction data to estimate housing units missing from the inventory of homes in 2019 (see https://upforgrowth.org/apply-the-vision/housing-underproduction/). Using 2021 ACS data and revisiting the methodology used by Up for Growth, I calculate simply “missing” households and do not adjust for vacant or uninhabitable units. Also, unlike Up for Growth which bases its analysis on PUMAs (public use micro-sample areas) for units of 100,000 persons to achieve full geographic coverage of the nation while sacrificing geographic fidelity with CBSAs, I sacrifice full geographic coverage for calculating the household gap for qualifying CBSAs. I also changed the terminology from the “household gap” to “missing households” but the method does not change.
The calculation for Missing Households is as follows:
Missing Households =
Headship rates between 15 to 34, 35 to 44, 45 to 54, 55 to 64, and 65 years of age or older from the 2000 Census, where headship rate is calculated as the number of householders within each age cohort divided by the number of persons also within each age cohort, times the number of persons within each age cohort from the 2021 ACS. The technique is more detailed than used in the Up for Growth Housing Underproduction study.
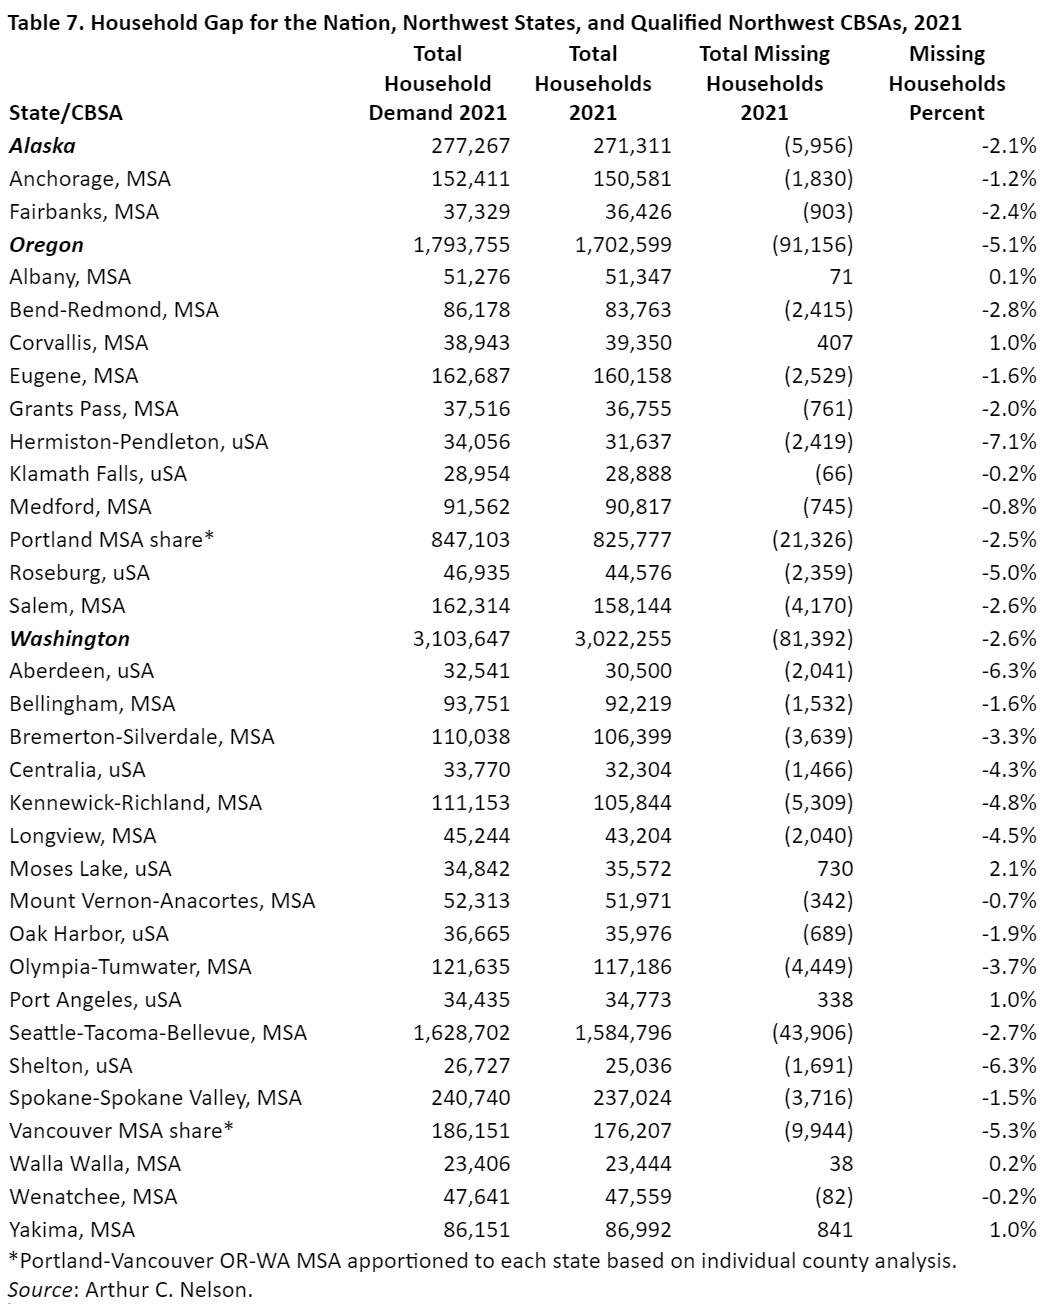
This calculation is done for each county within each CBSA based on the Census 2021 CBSA geographies, and then summed to each CBSA. It is also done for each state. Table 9 reports results for the Northwest states and their qualifying CBSAs.
The method assumes that the year 2000 reflected “normal” household formations in the absence of economic, social, or other turmoil. It also assumes constant headship rates by householder age with respect to race, ethnicity, and income over time, among other factors. While obviously not strictly true, the Census for 2000 was indeed a year at the end of a decade mostly devoid of economic, social, and other turmoil. Moreover, household incomes by race, ethnicity, and age have not changed much (unfortunately) between 2000 and 2021. Nonetheless, future work will focus on making more refined headship estimates that will be applied to more refined cohort data accounting especially for race and ethnicity. While readers can study these data for their own purposes, my focus here is on the larger picture.
Alaska
Alaska was “missing” about 6,000 households in 2021, meaning that those households were not formed because they were doubling up with others in the same housing unit. However, those missing households are mostly outside the Anchorage and Fairbanks MSAs, which have modest gaps in missing households.
Oregon
At about a 5.1% gap between households reported by the census and the number of households there should be, based on my analysis, Oregon leads the Northwest with more than 90,000 missing households. However, proportionately, the shortfall mostly comes from outside the three largest MSAs of Portland, Salem, and Eugene with shortfalls of 2.5%, 2.6% and 1.6%, respectively. Indeed, these rates are less than the national gap of about 3% calculated by Up for Growth in its housing underproduction analysis (1). Notably, at 5.3%, the Washington side of the Portland MSA, Vancouver, has a gap more than twice that of Portland. I mention this because Oregon’s statewide land use planning program is often criticized for stifling housing production. Relative to other major MSAs reviewed in my analysis, Oregon’s largest metropolitan areas fare as well and often better than their western peers in terms of missing households. I will highlight some key state policy efforts below. On the other hand, because the rest of the state has much higher household gaps, this may be a signal that policies that work in metropolitan areas may not work as well elsewhere.
Washington
With an estimated gap of 2.6% between existing households and those that should exist based on my analysis, Washington’s gap is roughly half that of Oregon and about the same as Alaska, as well as most other western states. Yet the gap among most of its largest MSAs is higher than Oregon’s. While the gap in Spokane is about 1.5%, for Seattle-Tacoma-Bellevue, the Vancouver side of the Portland MSA, and Olympia, it is 2.7%, 3.7%, and 5.3%, respectively.
I will use these figures to estimate households that will need to be housed in 2030.
New Homes Needed on the Range in the Northwest between 2021 and 2030
Planning is all about anticipating needs and choreographing the resources to meet them, consistent with the smart planning goals I outlined in the first article of this series. In this section, I project total new households for the Northwest and its qualified CBSAs. These include missing households. In effect, this is akin to estimating the need for occupied housing units since one household equals one occupied dwelling unit.
Table 8 reports the total households projected for 2030 by Woods & Poole Economics, the number of households existing in 2021 from the ACS, the number of new occupied housing units needed between 2021 and 2030, and the percent of those new units relative to households existing in 2021. These figures do not include the need for vacant units, seasonal homes, units not available for occupancy, or other types of units that are unoccupied. In resort areas, further adjustments are needed to address seasonal housing for both seasonal residents and the seasonal labor force. This figure also does not include housing units that may be lost over the decade because of disasters (such as floods and fires) or demolition to make way for redevelopment. I am engaged in research that will try to estimate this in future publications. As a rule of thumb, four tenths of one percent of the housing stock older than 10 years of age will be lost, so over the period 2021 to 2030 the equivalent of about 4.0% of the stock existing in 2020 would need to be added to the new dwelling unit demand. For now, I will be conservative because we are unlikely to meet the figures reported in Table 10, anyway.
While I will leave it to readers to assess the implications of Table 8 on their areas of interest, key overall findings are:
Between 2021 and 2030, more than 500,000 new households should be expected in the Northwest states who would occupy dwelling units if given a chance. This is roughly 8% more households than were estimated in 2021. The need comes to about 50,000 new dwelling units each year to meet both projected needs and provide a home for missing households.
Washington will clearly dominate projected demand with Oregon comprising about half that and Alaksa accounting for about 10% of the Northwest share.
By itself, the Seattle MSA will account for about 30% of the new household demand in the Northwest with the Portland-Vancouver MSA accounting for another 20%.
While the task of accommodating about a half million new households between 2021 and 2030 may seem like a significant challenge, it is manageable. For instance, if something on the order of one quarter of all homes larger than 2,000 square feet added an accessory dwelling unit (ADU) during this period, I estimate that we could meet household demand for all new dwellings needed to meet the needs of new households by 2030. After all, given the demographic trends presented in the first section, there will be a decline in Peak housing households with the largest share of change among Downsizing households and a smaller share among Starter home households. Figure 2 illustrates the nature of the housing needs of households to 2030 and beyond.
I conclude this article with a brief survey of key policies used in Oregon and Washington to expand housing supply.


Widely Varying Approaches to Meeting Housing Needs in the Northwest
Unlike in many mountain states, affordable housing issues have risen to the state level in Washington and Oregon through a variety of initiatives. I will offer a very cursory review of what those states are doing in this concluding section, starting with Washington.
Washington Focus
Washington’s Growth Management Act requires those jurisdictions falling within the Act’s purview to identify current and future housing needs and make plans and policies that help meet those needs (2). Two key state-enabling policies stand out. One is that cities are enabled to require mandatory affordability in multifamily construction projects. This would typically require a developer to provide a certain percentage of units in new multifamily projects that meet affordability standards. The other is that cities can incentivize affordable units through inclusionary zoning “bonuses” that increase building heights and densities in exchange for providing affordable units.
Oregon Focus
Oregon’s statewide land use planning program turned 50 in 1973 (3). Its keystones are preserving targeted open spaces and steering development into urban growth boundaries (UGBs). Development inside UGBs is facilitated through zoning that allocates land needed to meet long term needs without requiring new land use approvals, as well as clear and objective standards. In 2019, the legislature adopted a mandatory “middle housing” statute that essentially eliminated single family detached zoning statewide (with some exceptions) by allowing 2-, 3- and 4-plexes and townhomes by right (4).
Perspectives About the Northwest Going Forward
With scarce land supply and considerable growth pressures, the northwestern portions of Oregon and Washington face a balancing act, a challenge shared perhaps only by the Wasatch Front, Bay Area, and Southern California. I estimate that about a half million homes need to be built between 2021 and 2030 to meet the needs of missing households as well as new ones. Whether existing and new efforts, especially by Oregon and Washington states will meet the challenge is not clear.
About the Series Author
Arthur C. Nelson, Ph.D., FAICP, is Professor Emeritus of Urban Planning and Real Estate Development at the University of Arizona where he designed an online Master of Real Estate Development program that has become the nation’s top-rated and most diverse graduate real estate degree opportunity. He is also Presidential Professor Emeritus of City & Metropolitan Planning at the University of Utah where he was founding director of the Metropolitan Research Center, the Master of Real Estate Development program, and the doctorate in Metropolitan Planning, Policy and Design. Nelson is from Oregon and has engaged in professional practice and/or research in all the conterminous western states. He is the author of more than 20 books, more than 400 other publications, and has been a principal investigator or Co-PI of more than $50 million in grants and contracts.
©2023 by Arthur C. Nelson. All rights reserved.
FOOTNOTES
1. https://upforgrowth.org/apply-the-vision/housing-underproduction/
2. This is a hugely simplistic summary of a very complex set of requirements and processes. For details, see https://mrsc.org/explore-topics/planning/general-planning-and-growth-management/growth-management-act.
3. The author was a student intern on the joint legislative committee that wrote Senate Bill 100 which created the program.
4. For details about the program, see Megan Horst, ed., Toward Oregon 2050, Oregon State University Press (2024).