
Homes on the Range: California’s Missing Households
by Arthur C. Nelson, Ph.D., FAICP
Context
This fifth article of six installments for The Western Planner on housing demand in the West to 2030 focuses on California, the nation’s most populous state.
Figure 1. State of California revised in the Western Planner Series, Homes on the Range
Source: Map created from https://www.mapchart.net/usa.html
As a reminder to readers of this series, I estimate households that are missing from the census tabulations. The census defines a household as everyone living in the same dwelling unit regardless of circumstances. Housing planners use those data to project future housing needs, which is flawed in my view because this assumes current living arrangements will not change in the future.
For instance, according to the census, a three-person household could consist of three single adults living together in the same dwelling unit such as seen in the 1990s TV program “Friends,” set in New York City. In effect, there are three unattached adult individuals living together even though they may prefer to live in their own dwelling units. Maybe they choose to live together, but maybe they would choose to live in their own dwelling units if there was the opportunity to do so as seen in the 1990s TV program “Seinfeld,” also set in New York City.

Olivehurst, California (Image by Eric Brehm via Unsplash)
More complex would be a household composed of a married couple with two adult children, who also have spouses and perhaps their own children, who cannot find or afford a place of their own. This household is really composed of three units of people. I call those two other sets of people “missing households” and they better reflect the nature of unmet housing needs than conventional housing statistics.
This article is about those missing households in California and implications for housing policy and planning.
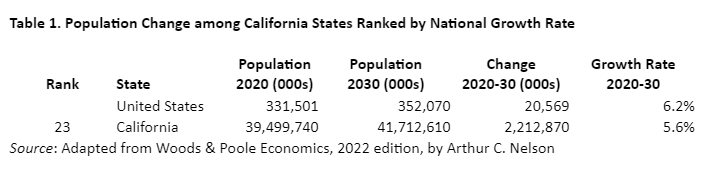
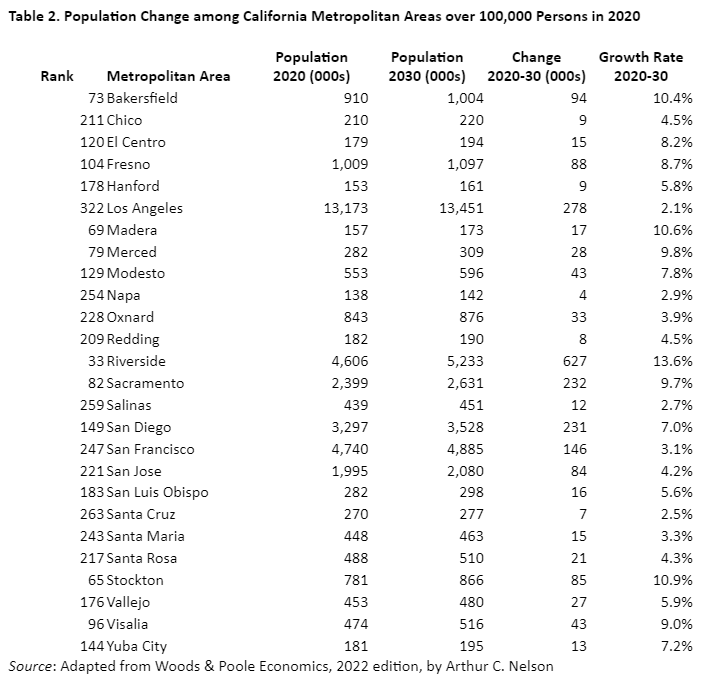
Let us begin with some overall context. Table 1 shows that between 2020 and 2030, four of the California states will be the nation’s 23rd fastest growing. California is projected to have an overall growth rate that is less than that of the nation during the 2020s, 5.6% compared to 6.2%. But the total population growth will exceed 2.2 million people in just 10 years, roughly the current total population of New Mexico.
Table 2 shows the growth and growth rates of the metropolitan statistical areas (MSAs) larger than 100,000 persons in 2020. (I exclude smaller MSAs because a small metro with just a few new developments can skew its growth rate when compared to larger metros. Of the 26 metro areas, 7 rank among the top quarter of growth rates among the 355 metro areas of more than 100,000 persons although none are in the top 20 in absolute rank. Moreover, these 11 MSAs will account for nearly all of California’s growth, 2,184,000 compared to 2,213,000 (rounded).
It is from this foundation that I will assess California and its “qualifying” metropolitan statistical areas (MSAs) of more than 65,000 residents—the census 1-year American Community Survey (ACS) threshold—in terms of:
Projecting households and change to 2030, focusing on the shift in households by householder age categories to reflect Starter home demand (householders under 35 years of age), Peak housing demand (householders between 35 and 64 years of age) and Downsizing (householders 65 years of age and older);
Reporting the gap between my estimated household demand and observed households in 2021, I use a method different from that reported in the first installment for reasons I will explain later;
Projecting overall household-based housing needs for the California western states and their qualifying MSAs; and
Addressing the extent to which state level policies are aligned to meet the housing needs of the California states—or not.
The bottom line is that I worry that the 20th century attitudes toward housing, which are especially prevalent in California, are not sufficient to address 21st century housing needs. But there is evidence that this may be changing, in ways I will illustrate later in the article.
The following sections are patterned after the second installment which addressed missing households in California. Accordingly, apologies to the astute reader for repetitious language.
Post Baby-Boom Household Trends

Simi Valley, California (Source: Anthony Fomin via Unsplash)
Housing demand is driven by households. A household is either a family or non-family group living in a single housing unit, meaning that one household regardless of its size or features equals one occupied housing unit. In this section, I estimate the overall demand for occupied housing units to 2030 for California’s qualifying MSAs. In the next section, I estimate the number of “missing” households using the 2021 ACS 1-year sample. These are households that have not formed for want of housing such as young adults returning home from college, young adults who stay home many years into adulthood, couples living as roommates, and so forth. For reasons explained in the second section, I use the 2000 Census as the benchmark year. While 2021 was the height of the COVID-19 pandemic, it was also the height of the largest housing boom since the middle 2000s, about 15 years earlier. By comparing the number of households there should be in 2021 based on the headship rates in 2000, I estimate the “missing households.” The third section calculates overall household demand in 2030 based on projections plus missing households in 2021. The final section highlights key efforts by California to expand housing supply to meet the needs of missing households.
I noted in the lead article of this series that a significant share of our civic leaders seem to have the view that the future will resemble their past. This is very short-sighted thinking with potentially catastrophic implications for housing. This section offers a sobering perspective for California.
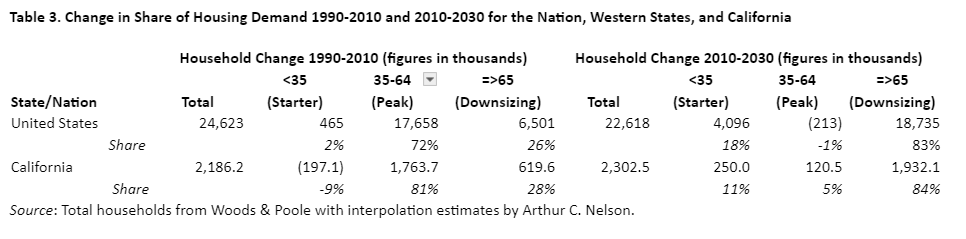
In review, I divide housing demand into three broad groups based on householder age. Those households headed by a person younger than 35 years of age are typically looking for Starter homes such as apartments, condominiums, townhouses, and smaller homes on smaller lots. Those between 35 and 64 years of age are at their Peak housing demand stage of life where partners with children and pets want larger homes on larger lots. America became a suburban nation between approximately 1960 and 1990 as parents of baby boom children, born between 1946 and 1964, desired housing and yard space which is exactly what suburbs provided to most of them. For their part, between approximately 1980 and 2010, boomers sought homes in the suburbs where they grew up to raise their families. Beginning in 2011, however, boomers began turning 65, which is the age at which I classify householders as Downsizing as they seek smaller homes on smaller lots or attached options. By 2029, all boomers will have entered the Downsizing stage, although this is certainly an overgeneralization. Table 3 shows the numerical shift in demand for housing by these three household types for the nation and California. Here are the key trends as I see them:
After seeing a reduction in Starter households during the period 1990-2010, Table 3 shows California will add such households but only at a rate that is about 60% that of the nation.
In contrast, after 20 years (1990-2010) when Peak demand households dominated growth share at 81%, that share will plummet to just 5% in the next 20 years (2010-2030).
Following national trends, California’s Downsizing households will dominate the change in share of households over the period 2010-2030 at 84% compared to the nation’s 83%. Indeed, California’s Downsizing households during this period will be three times higher than during the previous period, 1990-2010.
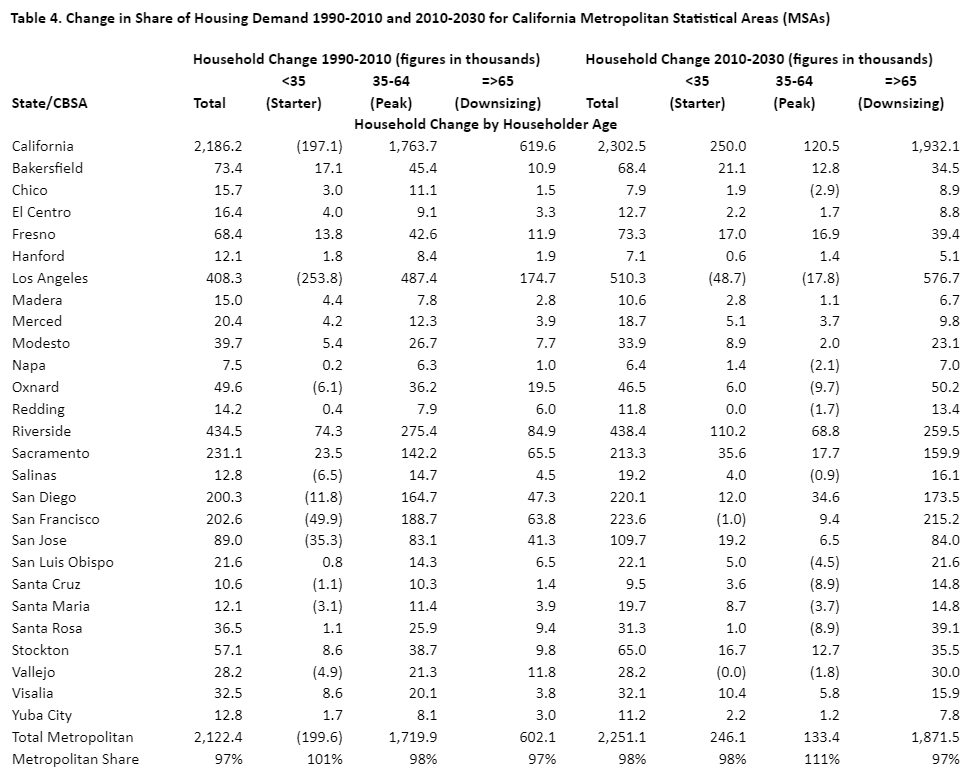
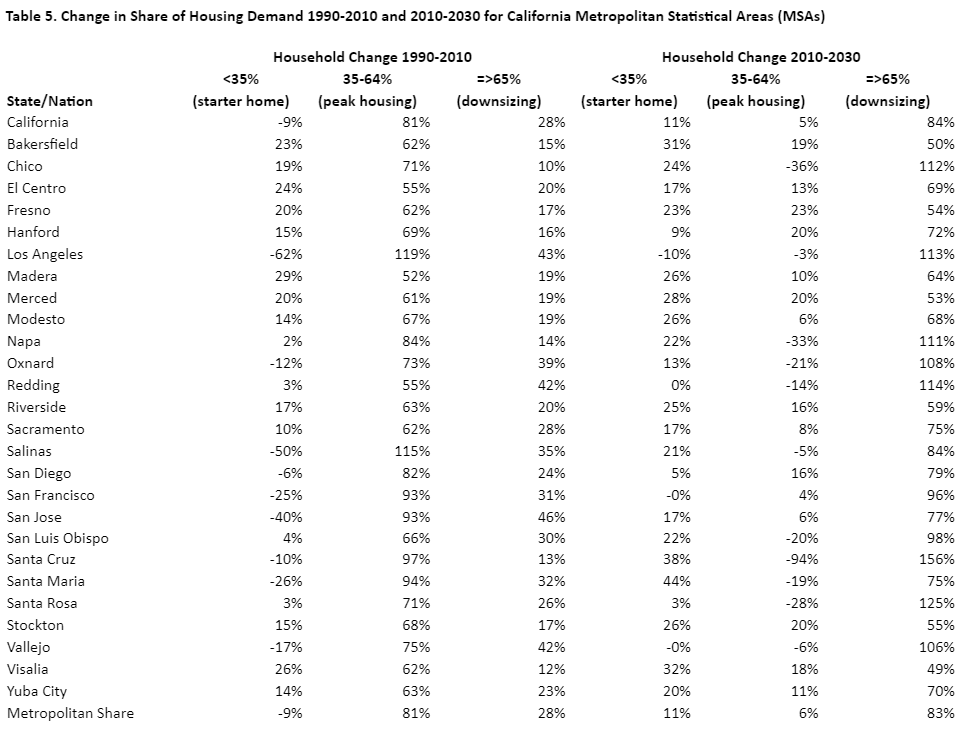
I do not know many elected officials who understand the implications of America’s aging households on housing markets in general or on their own communities. This series of articles in The Western Planner may give local planners and other professionals what they need to inform elected officials of the monumental change to come. This will be aided by Table 4 that reports estimates of household change by householder age for the qualifying MSAs while Table 5 reports the change in percentage growth shares. I invite readers to study these data more carefully for trends applicable to MSAs of interest to them. Here are the topline results for qualifying MSAs:
The Los Angeles MSA is projected to have fewer Starter and Peak demand households in 2030 compared to 2010, losing about 66,000 households combined. In contrast, Downsizing households will grow by nearly 580,000 between 2010 and 2030. Many tens, if not hundreds of thousands of households, may be receptive to California’s expanded by-right accessory dwelling unit (ADU) policies, which will be highlighted at the end of this article.
Most other MSAs will see similar trends, but there are exceptions. Bakersfield, Fresno, Merced, Riverside, and Visalia are projected to add as many Starter and Peak housing households as Downsizing ones between 2010 and 2030. Notably, these MSAs are located outside of the classically unaffordable California coastal counties.
Tables 4 and 5 provide planners and policymakers in California and their qualifying MSAs with guidance on the nature of change in housing demand between 2010 and 2030. Indeed, that change has been accelerating since 2010 and will not plateau until boomers begin passing away in large numbers starting in the 2030s. For the rest of this decade and well into the next, Downsizing households will dominate nearly all the markets and, in some cases, will be the only source of the change in housing demand.
I will next present estimates of the household gap in 2021 for the California states and their qualifying CBSAs.
Source: Total households from Woods & Poole (2022) with interpolation estimates by Arthur C. Nelson.
Source: Total households from Woods & Poole (2022) with interpolation estimates by Arthur C. Nelson.
Missing Households in California, 2021
In the opening article of this series, I noted that the nation arguably produced more housing than needed to meet market demand during the 2000s, which led in part to the Great Recession (GR) of 2007-09. Since then, production faltered from the period 2012, after the GR, to 2019, before the COVID-19 pandemic. The first article used Up for Growth’s Housing Underproduction data to estimate housing units missing from the inventory of homes in 2019 (see https://upforgrowth.org/apply-the-vision/housing-underproduction/). Using 2021 ACS data and revisiting the methodology used by Up for Growth, I calculate simply “missing” households and do not adjust for vacant or uninhabitable units. Also, unlike Up for Growth which bases its analysis on PUMAs (public use micro-sample areas) for units of 100,000 persons to achieve full geographic coverage of the nation while sacrificing geographic fidelity with CBSAs, I sacrifice full geographic coverage for calculating the household gap for qualifying CBSAs. I also changed the terminology from the “household gap” to “missing households” but the method does not change.
The calculation for Missing Households is as follows:
Missing Households =
Headship rates between 15 to 34, 35 to 44, 45 to 54, 55 to 64, and 65 years of age or older from the 2000 Census, where headship rate is calculated as the number of householders within each age cohort divided by the number of persons also within each age cohort, times the number of persons within each age cohort from the 2021 ACS. The technique is more detailed than used in the Up for Growth Housing Underproduction study.
This calculation is done for each county within each qualifying MSA based on the Census 2021 MSA geographies.

Santa Catalina, California (Source: Braden Egli via Unsplash)
The method assumes that the year 2000 reflected “normal” household formations in the absence of economic, social, or other turmoil. It also assumes constant headship rates by householder age with respect to race, ethnicity, and income over time, among other factors. While obviously not strictly true, the Census for 2000 was indeed a year at the end of a decade mostly devoid of economic, social, and other turmoil. Moreover, household incomes by race, ethnicity, and age have not changed much (unfortunately) between 2000 and 2021. Nonetheless, future work will focus on making more refined headship estimates that will be applied to more refined cohort data accounting especially for race and ethnicity. While readers can study these data for their own purposes, my focus here is on the larger picture.
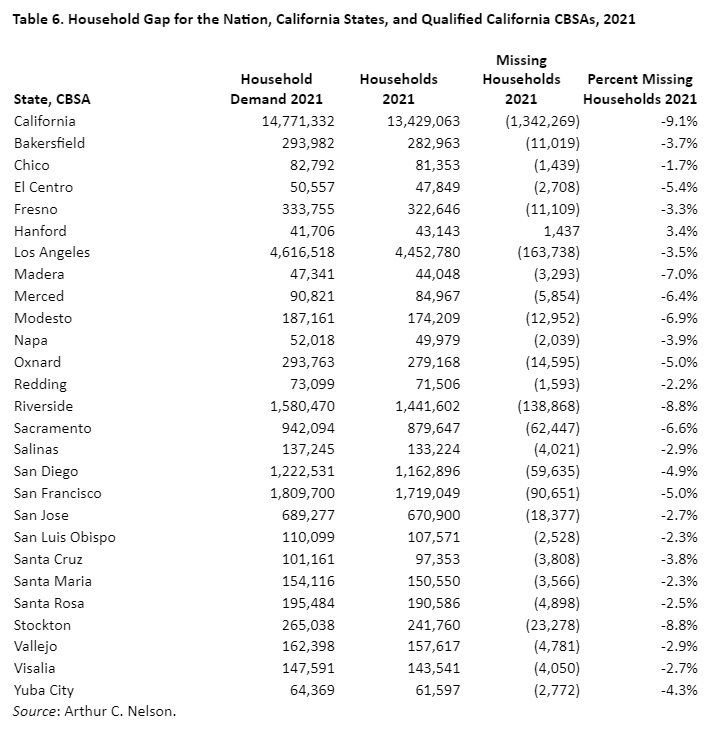
For the state, California was “missing” 1.3 million households, or about 9.1%, by far more than any other region numerically and in terms of share in this series for The Western Planner. Indeed, every MSA except Hanford has missing households. However, the distribution does not necessarily follow preconceived notions. For instance, while Los Angeles would seem a priori to be a lead in missing households, its share is only 3.5% which is at the low end of missing household rates. On the other hand, Madera (7.0%), Modesto (6.4%), Merced (6.9%), Riverside (8.8%), Sacramento (6.6%), and Stockton (8.8%) are the state’s leaders in missing households, with most of them in the Central Valley.
I will use these figures to estimate households that will need to be housed in 2030.
New Homes Needed on the Range in California between 2021 and 2030
Planning is all about anticipating needs and choreographing the resources to meet them, consistent with the smart planning goals I outlined in the first article of this series. In this section, I project total new households for California and its qualified MSAs. These include missing households. In effect, this is akin to estimating the need for occupied housing units since one household equals one occupied dwelling unit.
Table 7 reports the total households projected for 2030 by Woods & Poole Economics, the number of households existing in 2021 from the ACS, the number of new occupied housing units needed between 2021 and 2030, and the percent of those new units relative to households existing in 2021. These figures do not include the need for vacant units, seasonal homes, units not available for occupancy, or other types of units that are unoccupied. In resort areas, further adjustments are needed to address seasonal housing for both seasonal residents and the seasonal labor force. This figure also does not include housing units that may be lost over the decade because of disasters (such as floods and fires) or demolition to make way for redevelopment. I am engaged in research that will try to estimate this in future publications. As a rule of thumb, four tenths of one percent of the housing stock older than 10 years of age will be lost, so over the period 2021 to 2030 the equivalent of about 4.0% of the stock existing in 2020 would need to be added to the new dwelling unit demand. For now, I will be conservative because we are unlikely to meet the figures reported in Table 7 anyway.
While I will leave it to readers to assess the implications of Table 7 on their areas of interest, key overall findings are:
Between 2021 and 2030, nearly 1.5 million new households are expected to be created in California who would occupy dwelling units if given a chance. This is a roughly 11% increase in the number of households compared to 2021. This equates to approximately 150,000 new occupied dwelling units each year.
The MSAs comprising the Bay Area and Southern California’s largest MSAs will account for nearly one million of the future households, which is about 40% of the total need. The Central Valley, from Chico to Bakersfield, will account for nearly all the remaining households.
While the task of accommodating approximately 1.5 million new households between 2021 and 2030 may seem like a significant challenge, it is manageable. For instance, if something on the order of a fifth of all homes larger than 2,000 square feet added an accessory dwelling unit (ADU) during this period, I estimate that more than enough new housing can be added to accommodate household growth. California has become a national leader in allowing for these additions. Indeed, since nearly all the change in households in most MSAs will be among Downsizing households, it would seem that the motive and opportunity exist to do so. The market certainly exists, as illustrated in Figure 2.
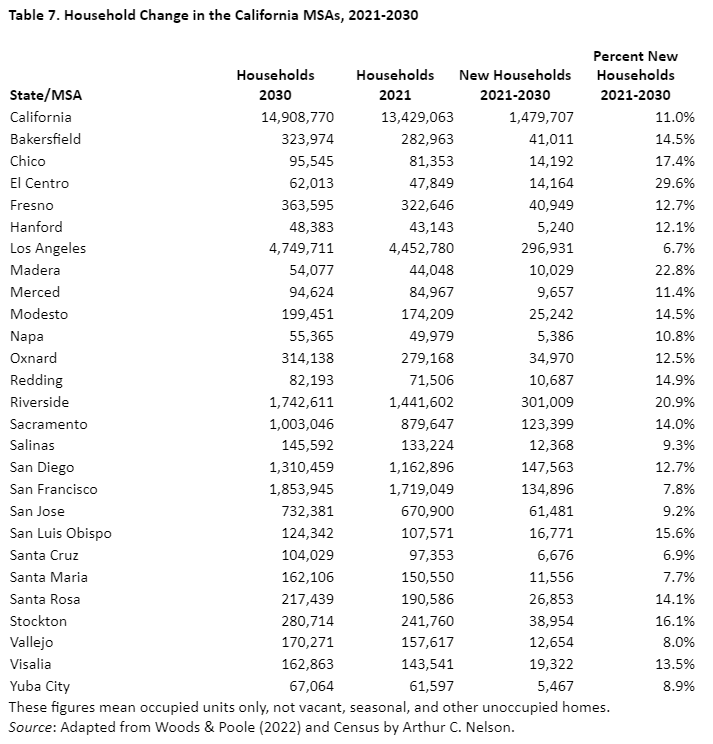
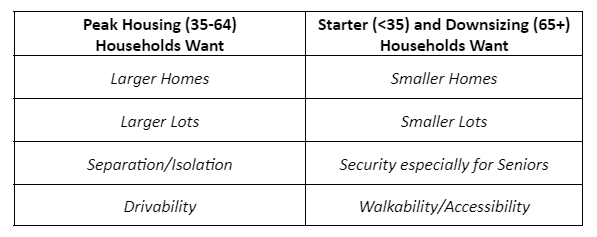
Figure 2. What Peak, Starter and Downsizing households want for their homes and communities
Note: 65+ means householders who are 65 years of age or older.
State Preemption of Local Land Use Regulation in the California
California’s housing crisis has resulted in undersupplied housing, and therefore high prices. The reasons are legion, including but not limited to: (1)
NIMBYism ("Not in My Back Yard") where neighbors often oppose anything and especially higher density/lower cost housing.
Local exclusionary zoning.
Environmental laws through the California Environmental Quality Act (CEQA) that create expensive and time-consuming processes fraught with litigation.
Tax structures, especially Proposition 13, that limit the residential property taxes local and state governments can collect while incentivizing commercial and industrial zoning, even if it means over-supplying the market with nonresidential development.
High land cost because of scarce buildable land combined with low density.
High construction and labor costs because of California's extensive and expensive building/development codes and labor laws.
According to Bill Fulton and colleagues at the Terner Center for Housing Innovation (2), the California legislature has adopted a bewildering array of more than 100 laws aimed at expanding housing supply since 2017. Six efforts are highlighted here: 1. accessory dwelling units; 2. small-scale projects; 3. allowing apartments in certain commercial zones; 4. expanding the state’s density bonus laws; 5. streamlining review of targeted residential projects; and 6. enforcing California’s rigorous housing element requirements. The following summarizes key features of each. Reference to specific statutes is provided by Fulton et al. (2023).
For the most part, ADUs have become by-right permitted land uses in single-family residential zones as ministerial as opposed to quasi-judicial actions. This removes public engagement in issuing ADU permits. Whereas before the suite of ADU laws went into effect, only about one hundred ADU permits were issued monthly. As of 2023, the figure is in the thousands of units per month.
Another area of state preemption is policies intended to increase the supply of "missing middle" units, such as through duplexes and lot splits, including the ability to carve out a unit from the existing home much like a condominium to townhouse. The Terner Center estimated that this policy has the potential to create 700,000 new housing units statewide. (3)
A third area of preemption is broadening entitlements to apartment development in commercial zones. Recent laws prohibit local governments from having parking mandates within a half-mile of qualifying transit stops. They also allow developers to override local zoning to build residential projects on land zoned for retail and offices.
California has long had density bonus laws (DBLs) to incentivize adding affordable housing units in large-scale residential and mixed-use projects. Conceptually, this fourth effort allows density by-right bonuses where affordable units are in qualifying developments. The DBLs also mandates certain concessions and waivers including relaxing development standards. Developments meeting state standards can receive a 50% density bonus where projects dedicate 15% to lower-income households. Another law provides that if 100% of the residential units are affordable, the density bonus increases to 80%, and there is an unlimited density bonus for affordable housing developments of up to three floors if located within a quarter mile of qualifying transit stops.
Preemption of local permitting is a fifth state effort. Like most states, California gives local governments considerable discretion in reviewing proposals for entitlement. Proposals can be denied even if they are in accordance with the local general plan and zoning standards. This occurs when projects are determined to be reviewable under CEQA often resulting in conditions of approval aimed at mitigating development with two perverse outcomes: (1) if the conditions are too onerous the project does not get built and some level of mitigation does not occur and (2) projects that fall under the CEQA review threshold, but with equal or more impact, proceed without any mitigation. One effort to streamline the review process exempts qualifying affordable housing projects from CEQA review. That provision sets minimum thresholds for affordable units that vary based on the project size and jurisdiction.
The sixth effort is enforcing the state’s Housing Element Law which was passed in 1969. Every local general plan must have a Housing Element. In recent years, the Housing Element was required to comply with a Regional Housing Needs Assessment (RHNA) planning process, the result of which is regional coordination of efforts to meet local and regional housing needs. The only trouble is that regional housing needs were not met because too many local governments found ways to avoid implementing them. With apologies for glossing over many of the details of how the Housing Element and RHNA processes work, state laws now require consideration of housing cost burdens, overcrowding, and fair housing, and others to establish new housing production targets within discrete time periods. To make this effective, the state Attorney General’s office has been directed by the legislature to enforce these new laws. In theory, Housing Elements should no longer gather dust on local government shelves. Time will tell, of course, whether these new laws facilitate expansion of housing supply.
Nonetheless, despite these advances, Gill and Schuetz (2023) of the Brookings Institution warn: (4)
The pro-housing movement has gained political momentum in recent years, but its modest legislative successes are pushing against decades of restrictive local zoning, underbuilding, and anti-growth policies backed by multiple influential constituencies.
I conclude with personal perspectives about California’s renewed efforts to meet the needs of all households who want a home, including missing households.
Perspectives About California Going Forward
California’s recent efforts to expand housing supply, especially for lower income households, represent a generational shift. The period from post-World War II to 2011, when the oldest Baby Boomers (born 1946-1964) turned 65, defined California’s challenge in meeting the housing needs of households with children. Although the Baby Boom generation is now downsizing, this is not adequately reflected in many local plans. This has required the state to preempt local government land use planning and implementation processes to address housing needs generally, and affordable housing particularly. Perhaps without a comprehensive understanding of the implications of demographic changes on housing demand, the legislature has become proactive in creating new options to increase housing supply to meet California’s new demographic reality. The rest of the nation should take note.
About the Series Author
Arthur C. Nelson, Ph.D., FAICP, is Professor Emeritus of Urban Planning and Real Estate Development at the University of Arizona where he designed an online Master of Real Estate Development program that is also the nation’s top-rated and most diverse online graduate real estate degree. He is also Presidential Professor Emeritus of City & Metropolitan Planning at the University of Utah where he was founding director of the Metropolitan Research Center and the Master of Real Estate Development Program as well as the doctoral program in Metropolitan Planning, Policy, and Design. Nelson is from Oregon and has engaged in professional practice and/or research in all the conterminous western states. He is the author of more than 20 books, more than 400 other publications, and has been a principal investigator or Co-PI of more than $50 million in grants and contracts.
©2023 by Arthur C. Nelson. All rights reserved.
Footnotes
1. For a review, see https://en.wikipedia.org/wiki/California_housing_shortage.
2. For a detailed review, see Bill Fulton, David Garcia, Ben Metcalf, Carolina Reid, and Truman Braslaw (2023). New Pathways to Encourage Housing Production: A Review of California’s Recent Housing Legislation. Berkeley CA: University of California, Berkeley, Terner Center for Housing Innovation. Much of the details of California’s innovations reviewed in this article is adapted from Fulton et al.
3. Metcalf, B., et al. (2021). Will Allowing Duplexes and Lot Splits on Parcels Zoned for Single-Family Create New Homes?” Terner Center for Housing Innovation at UC Berkeley. Retrieved from: https://ternercenter.berkeley.edu/wp-content/uploads/2021/07/SB-9-Brief-July-2021-Final.pdf.
4. Julia Gill and Jenny Schuetz (2023), In California, statewide housing reforms brush against local resistance. Washington DC: Brookings Institution.