
Communicating Climate Change in the Southwest
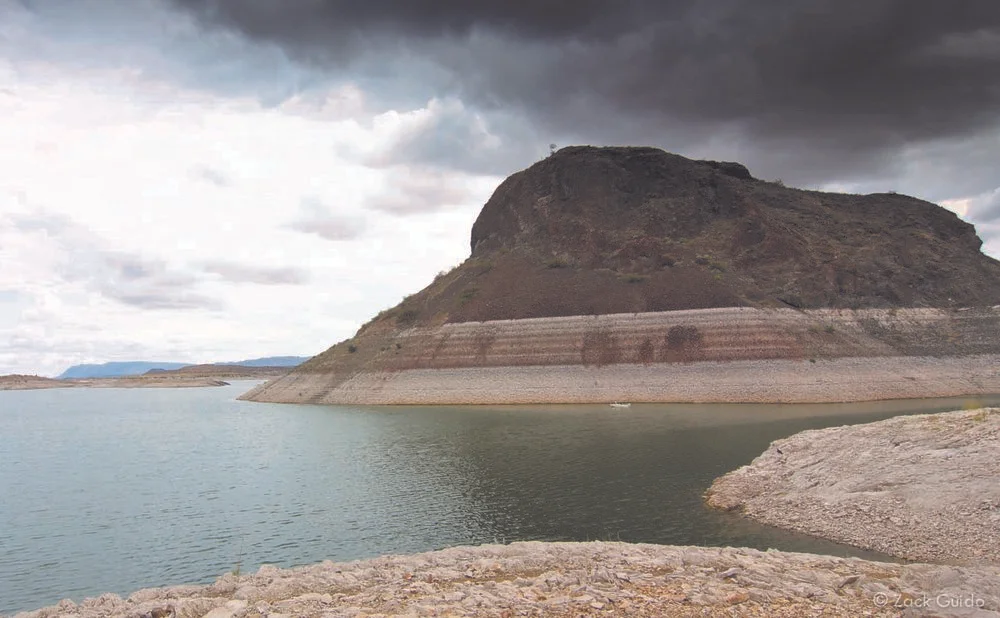
A PICTURE IS WORTH A THOUSAND WORDS. LOCATED IN SOUTHERN NEW MEXICO AND FED BY THE RIO GRANDE, ELEPHANT BUTTE RESERVOIR HAS DWINDLED TO LOW LEVELS DUE TO DROUGHT CONDITIONS. PHOTO BY DR. ZACK GUIDO.
by Katherine Mortimer, Santa Fe, New Mexico
More frequent and intense climate events result in increased demand on our emergency response systems, greater financial impacts, and greater public health impacts. The challenge is to effectively communicate the ever-increasing demands these events place on our communities and get individuals, communities, and government to prepare.
The challenge to understanding the effects of climate change in the Southwest is that the events look a lot like events commonly experienced here. The “big five” for the Southwest include temperature extremes, floods, drought, fire, and wind, all of which commonly occur in the Southwest under historic weather patterns. The difference is in the frequency and severity of these events. More frequent and intense climate events result in increased demand on our emergency response systems, greater financial impacts, and greater public health impacts. The challenge is to effectively communicate the ever-increasing demands these events place on our communities, and get individuals, communities, and government to both prepare and reduce greenhouse gas emissions, so the ultimate impacts of climate change are lessened from what they could be.
For those of us living in non-coastal communities that don’t have an ocean lapping at our edges, menacing huge populations and infrastructure, how do we understand and communicate the need to prepare and mitigate? A group of Western communities has banded together to create the Western Adaptation Alliance, a regional network of sustainability professionals in local governments working together to understand and develop tools to address our unique climate change adaptation challenges. The alliance includes 14 municipalities in Arizona, Colorado, Nevada, New Mexico, Texas and Utah.1
The Western Adaptation Alliance represents five of the 13 Western Planner member states; however, it is supported by the Urban Sustainability Directors Network (USDN), a member-led and member-driven network supported by staff and grant resources and includes all of the Western Planner states. The Western Adaptation Alliance is one of several regional networks that have emerged from the collaborations between sustainability directors who have identified common challenges within a specific region and formed similar regional networks to address those common needs. With support from the Urban Sustainability Directors Network, Western Adaptation Alliance members plan to leverage the benefits of these tools to maximize their impact within their communities.2
INCREASING TEMPERATURES. ABOVE SOURCE: NATIONAL OCEANIC AND ATMOSPHERIC ADMINISTRATION.
The alliance identified the challenge of communicating the impacts that climate change is already having on the region and received an Innovation Fund for Regional Networks Dissemination grant from the Urban Sustainability Directors Network. The grant was given to Western Adaptation Alliance to catalog how these events have been changing in recent decades, to evaluate how they have and will continue to affect the communities and surrounding region, and develop tools to communicate the findings. The Western Adaptation Alliance contracted with the Climate Assessment for the Southwest (CLIMAS)3 for this analysis. This research institution is housed at the University of Arizona’s Institute of the Environment and partners with New Mexico State University to bring together researchers who study the processes and effects of climate on the Southwest.
The trouble with data is that most people don’t understand what it implies. Numbers and lines on a graph are impersonal. Note the National Oceanic and Atmospheric Administration graph above showing that temperatures in the Southwest are increasing. While alarming to most people, the visceral understanding of what this means is elusive. The tool CLIMAS is developing ads, images and stories from local events to each community in the study to give a real face to the implications of these temperature changes.
SOURCE: THE U.S. DROUGHT MONITOR.
The narrative and accompanying images from recent local events add a visceral connection to the data. People remember when these events took place and how it felt to see the impacts at that time. It contributes a dimension of reality that data and graphs alone cannot convey. For example, the photo of Elephant Butte Reservoir in New Mexico shows the impact of drought on water supplies more than the map of drought conditions.
Both the image and the map provide information that, taken together, can be used to better understand, and therefore, respond to the effects of climate change in our communities. Images of local events that trigger people’s memories of when those events took place are even more compelling. The images of flood damage in New Mexico in September 2013 recall the impacts to the community of that event. Similar images of the damage caused by local extreme wind, heat, fire and flood events will be included in each story map.
While the communication tools aren’t yet complete, preliminary versions provided by CLIMAS are both compelling and promising in how they can be used to effectively communicate the need to take action now. The data clearly shows that the intensity and frequency of extreme weather events are increasing throughout the southwest. Using an online communication tool, that data is being linked to images and narratives that tell the stories in ways everyone can understand. These tools are already being used by others to tell similar stories, such as a story map developed by the University of New Mexico describing New Mexico flood events.
The tool takes advantage of the most current methods of understanding the effects of climate change on weather patterns. For example, the draft CLIMAS tool on drought provides the standardized precipitation-evapotranspiration index (SPEI) for four southwestern states. SPEI is a drought index that takes into account both rainfall and evaporation when measuring drought conditions. The SPEI can measure drought severity according to its intensity and duration, and can identify the onset and end of drought episodes. The SPEI allows comparison of drought severity through time and space, since it can be calculated over a wide range of climates. Its multi-scalar characteristics enable identification of different drought types and impacts in the context of global warming.4

DROUGHT INDEX. SOURCE: WESTWIDE DROUGHT TRACKER, WESTERN REGIONAL CLIMATE CENTER.
The tool will ultimately provide a substantial amount of information about all five types of extreme weather events. Some of which is interactive, allowing for a greater understanding of the implications of the events and why they are expected to increase in both intensity and frequency as temperatures rise. The tool can be customized giving local governments the option of adding information about goals for adapting, actions taken, and progress towards those goals realized from the actions. Thus, it can be used as both a planning and reporting tool and updated as new extreme weather events occur and as new actions or implementation data become available. However, the tool alone will not affect the kind of actions needed to address the effects of climate change. The Western Adaptation Alliance will continue to work through the Urban Sustainability Directors Network to develop strategies to disseminate both the tool and the information within it to communities and city leaders to leverage the communication value the tool represents.
Story Map of 2013 New Mexico flood events

The University of New Mexico developed an online story map that describes New Mexico flood events in 2013 with the following partners U.S. Army Corps of Engineers, National Weather Service,New Mexico Floodplain Managers Association, New Mexico Department of Homeland Security and Emergency Management and the Earth Data Analysis Center. Visit this story map online at https://univofnm.maps.arcgis.com/apps/MapJournal/?appid=e88db56dccef48ea92ae69a4705adb9d.
Esri Story Maps combine maps with narrative content, images, and multimedia content to tell a story. Text that is underlined like a traditional hyperlink will take you to independent content outside of the story map and will open in a new tab or browser window. Text that has a dashed underline will change the main content of the story map on the right side of the screen without leaving the story map. Esri Story Maps are built into ArcGIS Online, the cloud-based web mapping system that’s part of ArcGIS, the world’s leading mapping and GIS platform. Anyone with any type of ArcGIS Online account can create story maps at no extra cost.

Katherine Mortimer is the Supervising Planner in the City of Santa Fe Land Use Department in New Mexico. She has an extensive background in environmental planning.
ENDNOTES
- Western Adaptation Alliance, Institute for Sustainable Communities. http://www.iscvt.org/program/western-adaptation-alliance-waa/.
- Regional Climate Adaptation Planning Alliance Report on Climate Change and Planning Frameworks for the Intermountain West. Prepared by ICLEI For Members of the Urban Sustainability Directors Network, August 2011. http://usdn.org/uploads/cms/documents/western-states-regional-climate-change-adaptation-alliance.pdf.
- Climate Assessment for the Southwest (CLIMAS). http://www.climas.arizona.edu.
- Standardized precipitation-evapotranspiration index: http://sac.csic.es/spei/home.html.
Published in February/March 2016